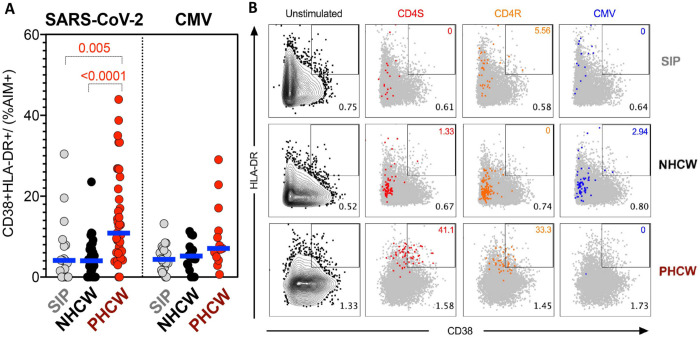
Figure 5. Highest PHCW reactivity in CD4+ T cell responses associated with recent infection.
(A) Recently activated SARS-CoV-2-specific CD4+ T cells were measured as percentage of CD38+/HLA-DR+ cells in AIM+ (OX40+CD137+) CD4+ T cells after stimulation of PBMCs with peptide pools encompassing a spike only (“S”) MP and MP representing all the proteome without spike (“CD4R”). Graphs show data for specific responses against SARS-CoV-2 (both “S” and “CD4R”) the ubiquitous pathogen CMV of responses with SI>2. Each dot represents the response of an individual subject to an individual pool. Geometric mean for the 3 different groups is shown. Non-parametric Kruskal-Wallis multiple comparison test was applied. P values are shown for the statistical significant comparisons. “SIP” = Shelter In Place community volunteers (n=20). “NHCW” = SeroNegative Health Care Workers (n=33). “PHCW” = Antibody or PCR Positive Health Care Workers (n=39). (B) Representative FACS plots of HLA-DR/CD38+ cells in AIM+ (OX40+CD137+) CD4+ T cells (colored) overlapped with total HLA-DR/CD38 expression (grey) for all the cohorts in the different unstimulated or stimulated conditions. Cell frequency of HLA-DR/CD38+ in AIM+ cells or total CD4+ T cells is indicated on the top and bottom right corner respectively.

