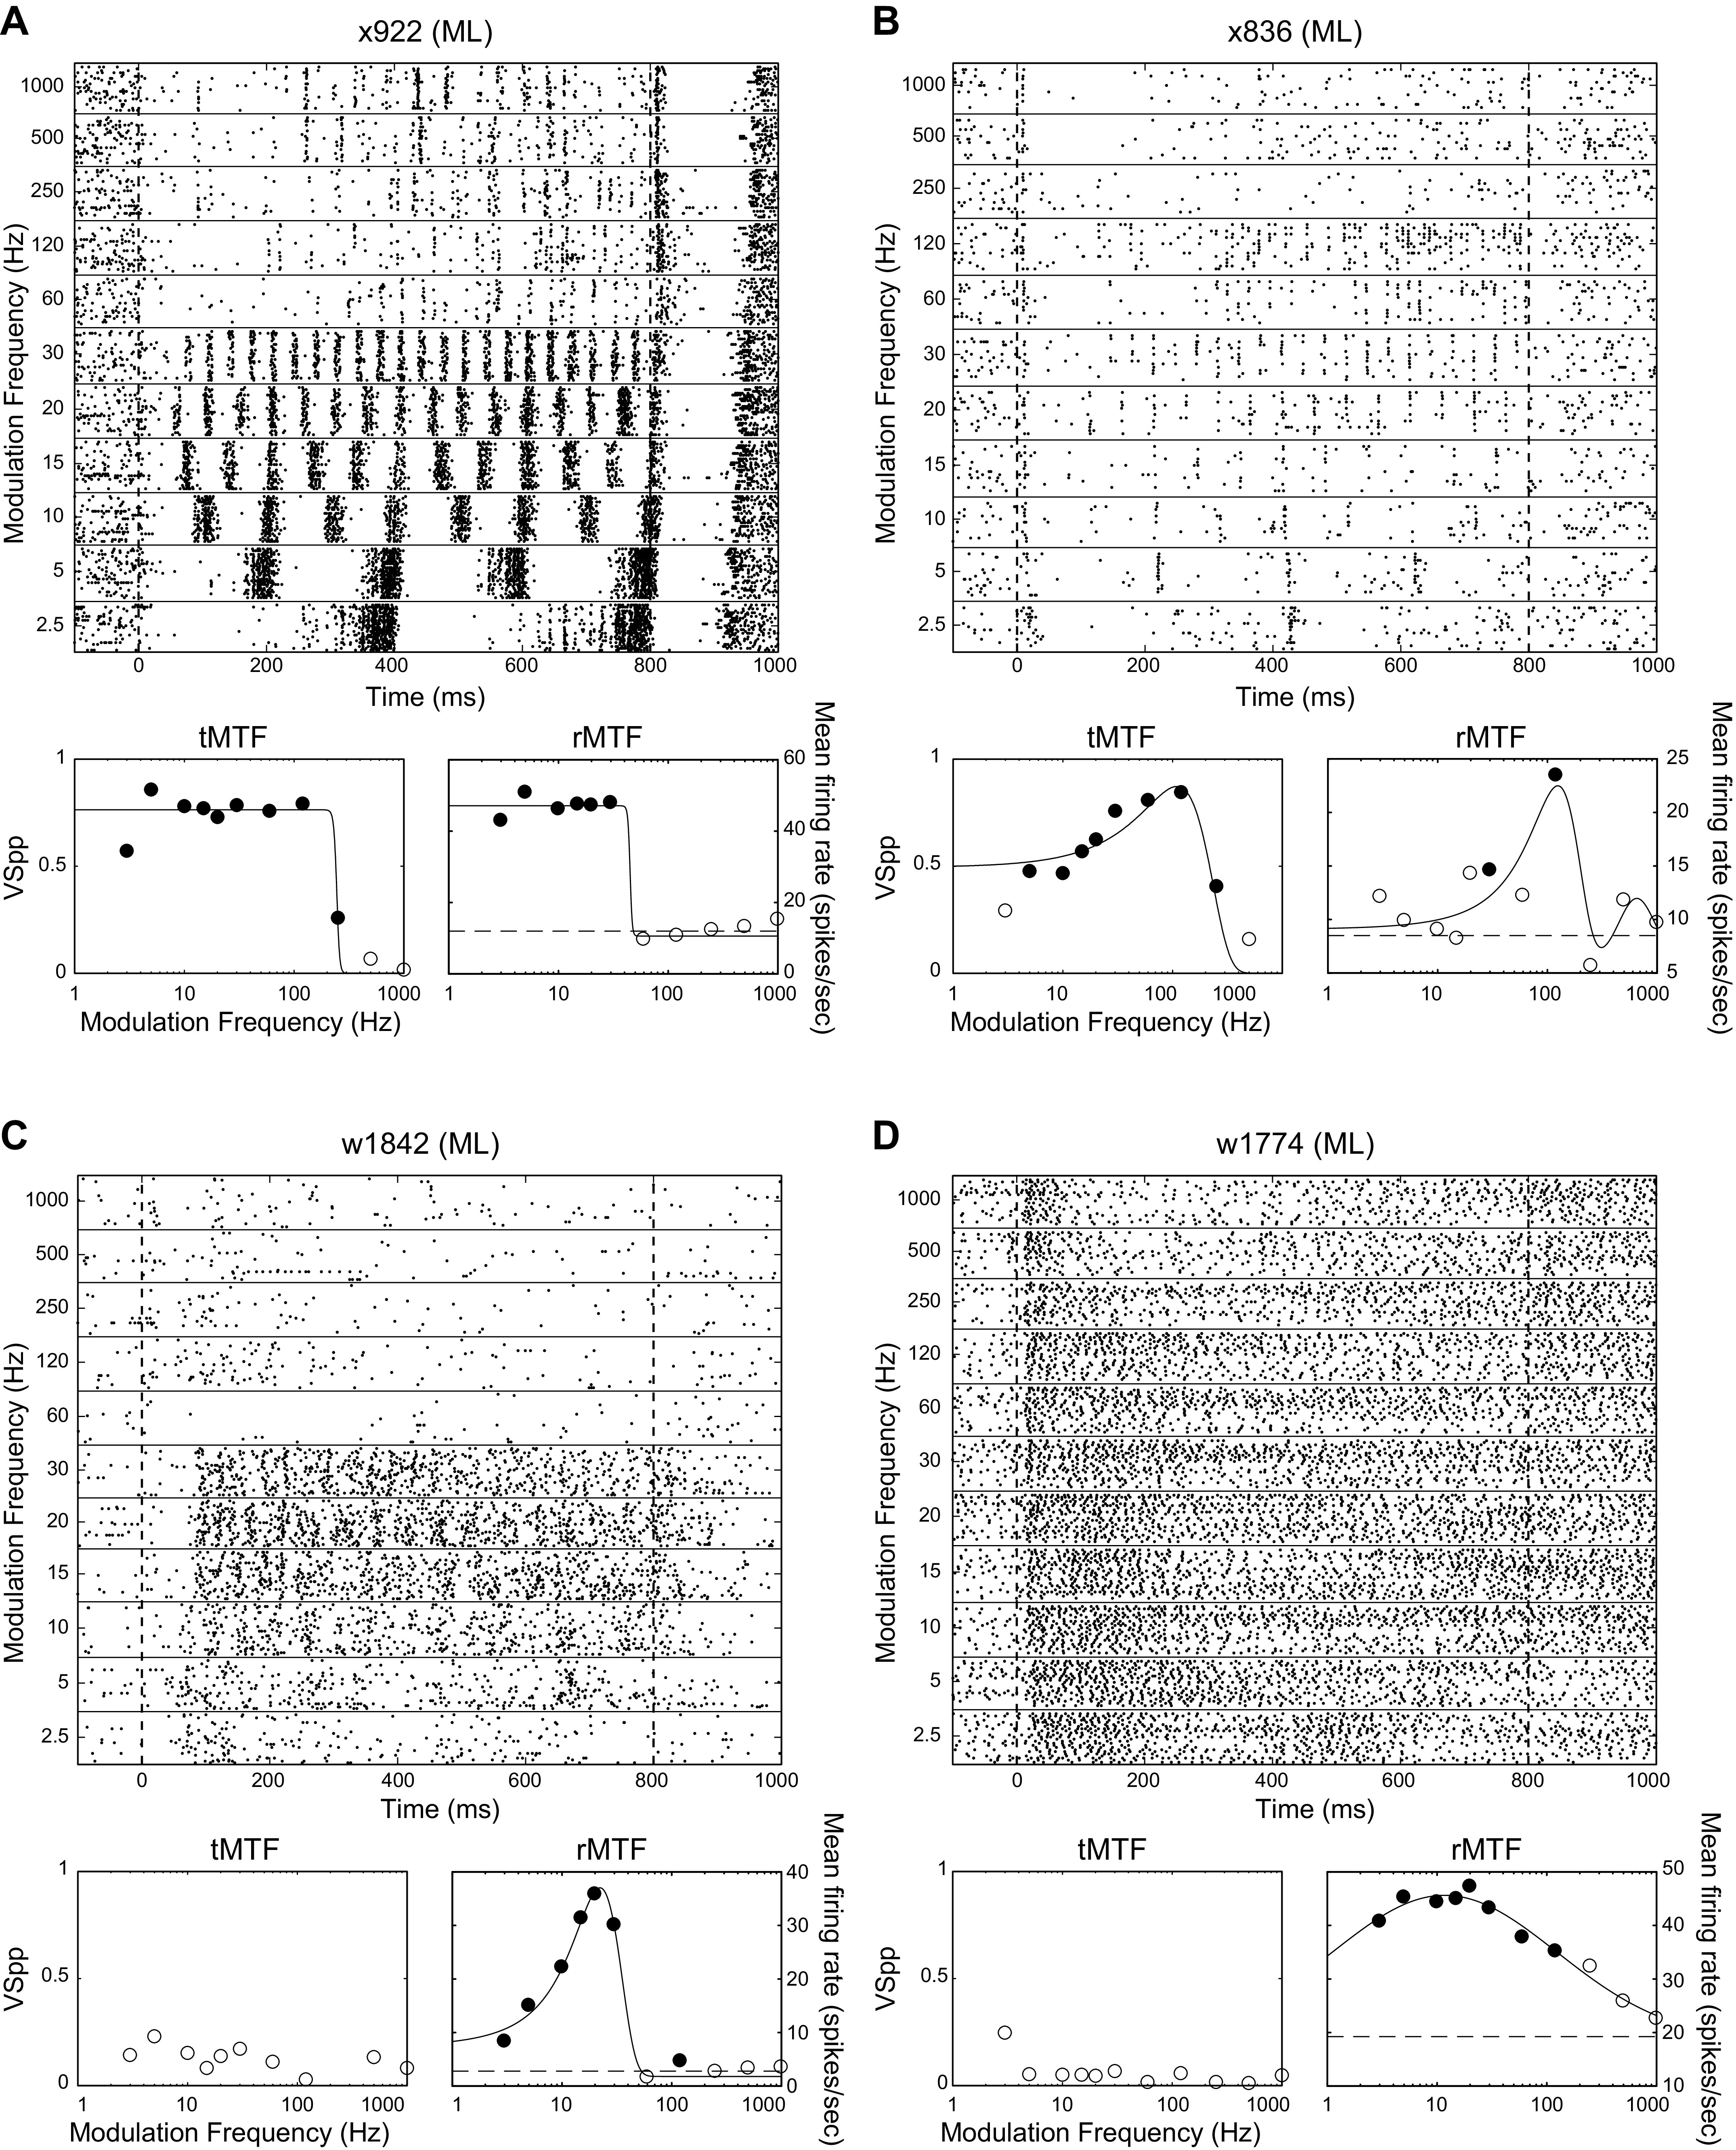
Fig. 2.

Example responses of ML neurons to AM noise. The responses to AM noise, and the modulation transfer functions are shown for four different example neurons (A–D). For each neuron, we show the responses to the 11 tested modulation frequencies with raster plots on the top. Below each raster plot are temporal (left, tMTF) and rate (right, rMTF) modulation transfer functions (MTFs) for the same neurons. Filled dots on the tMTFs indicate modulation frequencies at which there is significant phase locking (t test, P < 0.05 corrected for 11 comparisons), filled dots on the rMTFs indicate modulation frequencies at which the firing rate differed from the firing rate to the unmodulated stimulus (t test, P < 0.05 corrected for 11 comparisons). Dashed line on rMTFs indicates the firing rate to the unmodulated noise stimulus. For all four examples, the only points on the rMTF with significant response differences from the response to unmodulated noise (filled circles) were above the unmodulated noise response (dashed line), so they were all classified as increasing for Table 2. Best frequencies of cells depicted, by panel: A, 6 kHz; B, 11 kHz; C, 1.7 kHz; and D, 31 kHz.
