
Fig. 10.
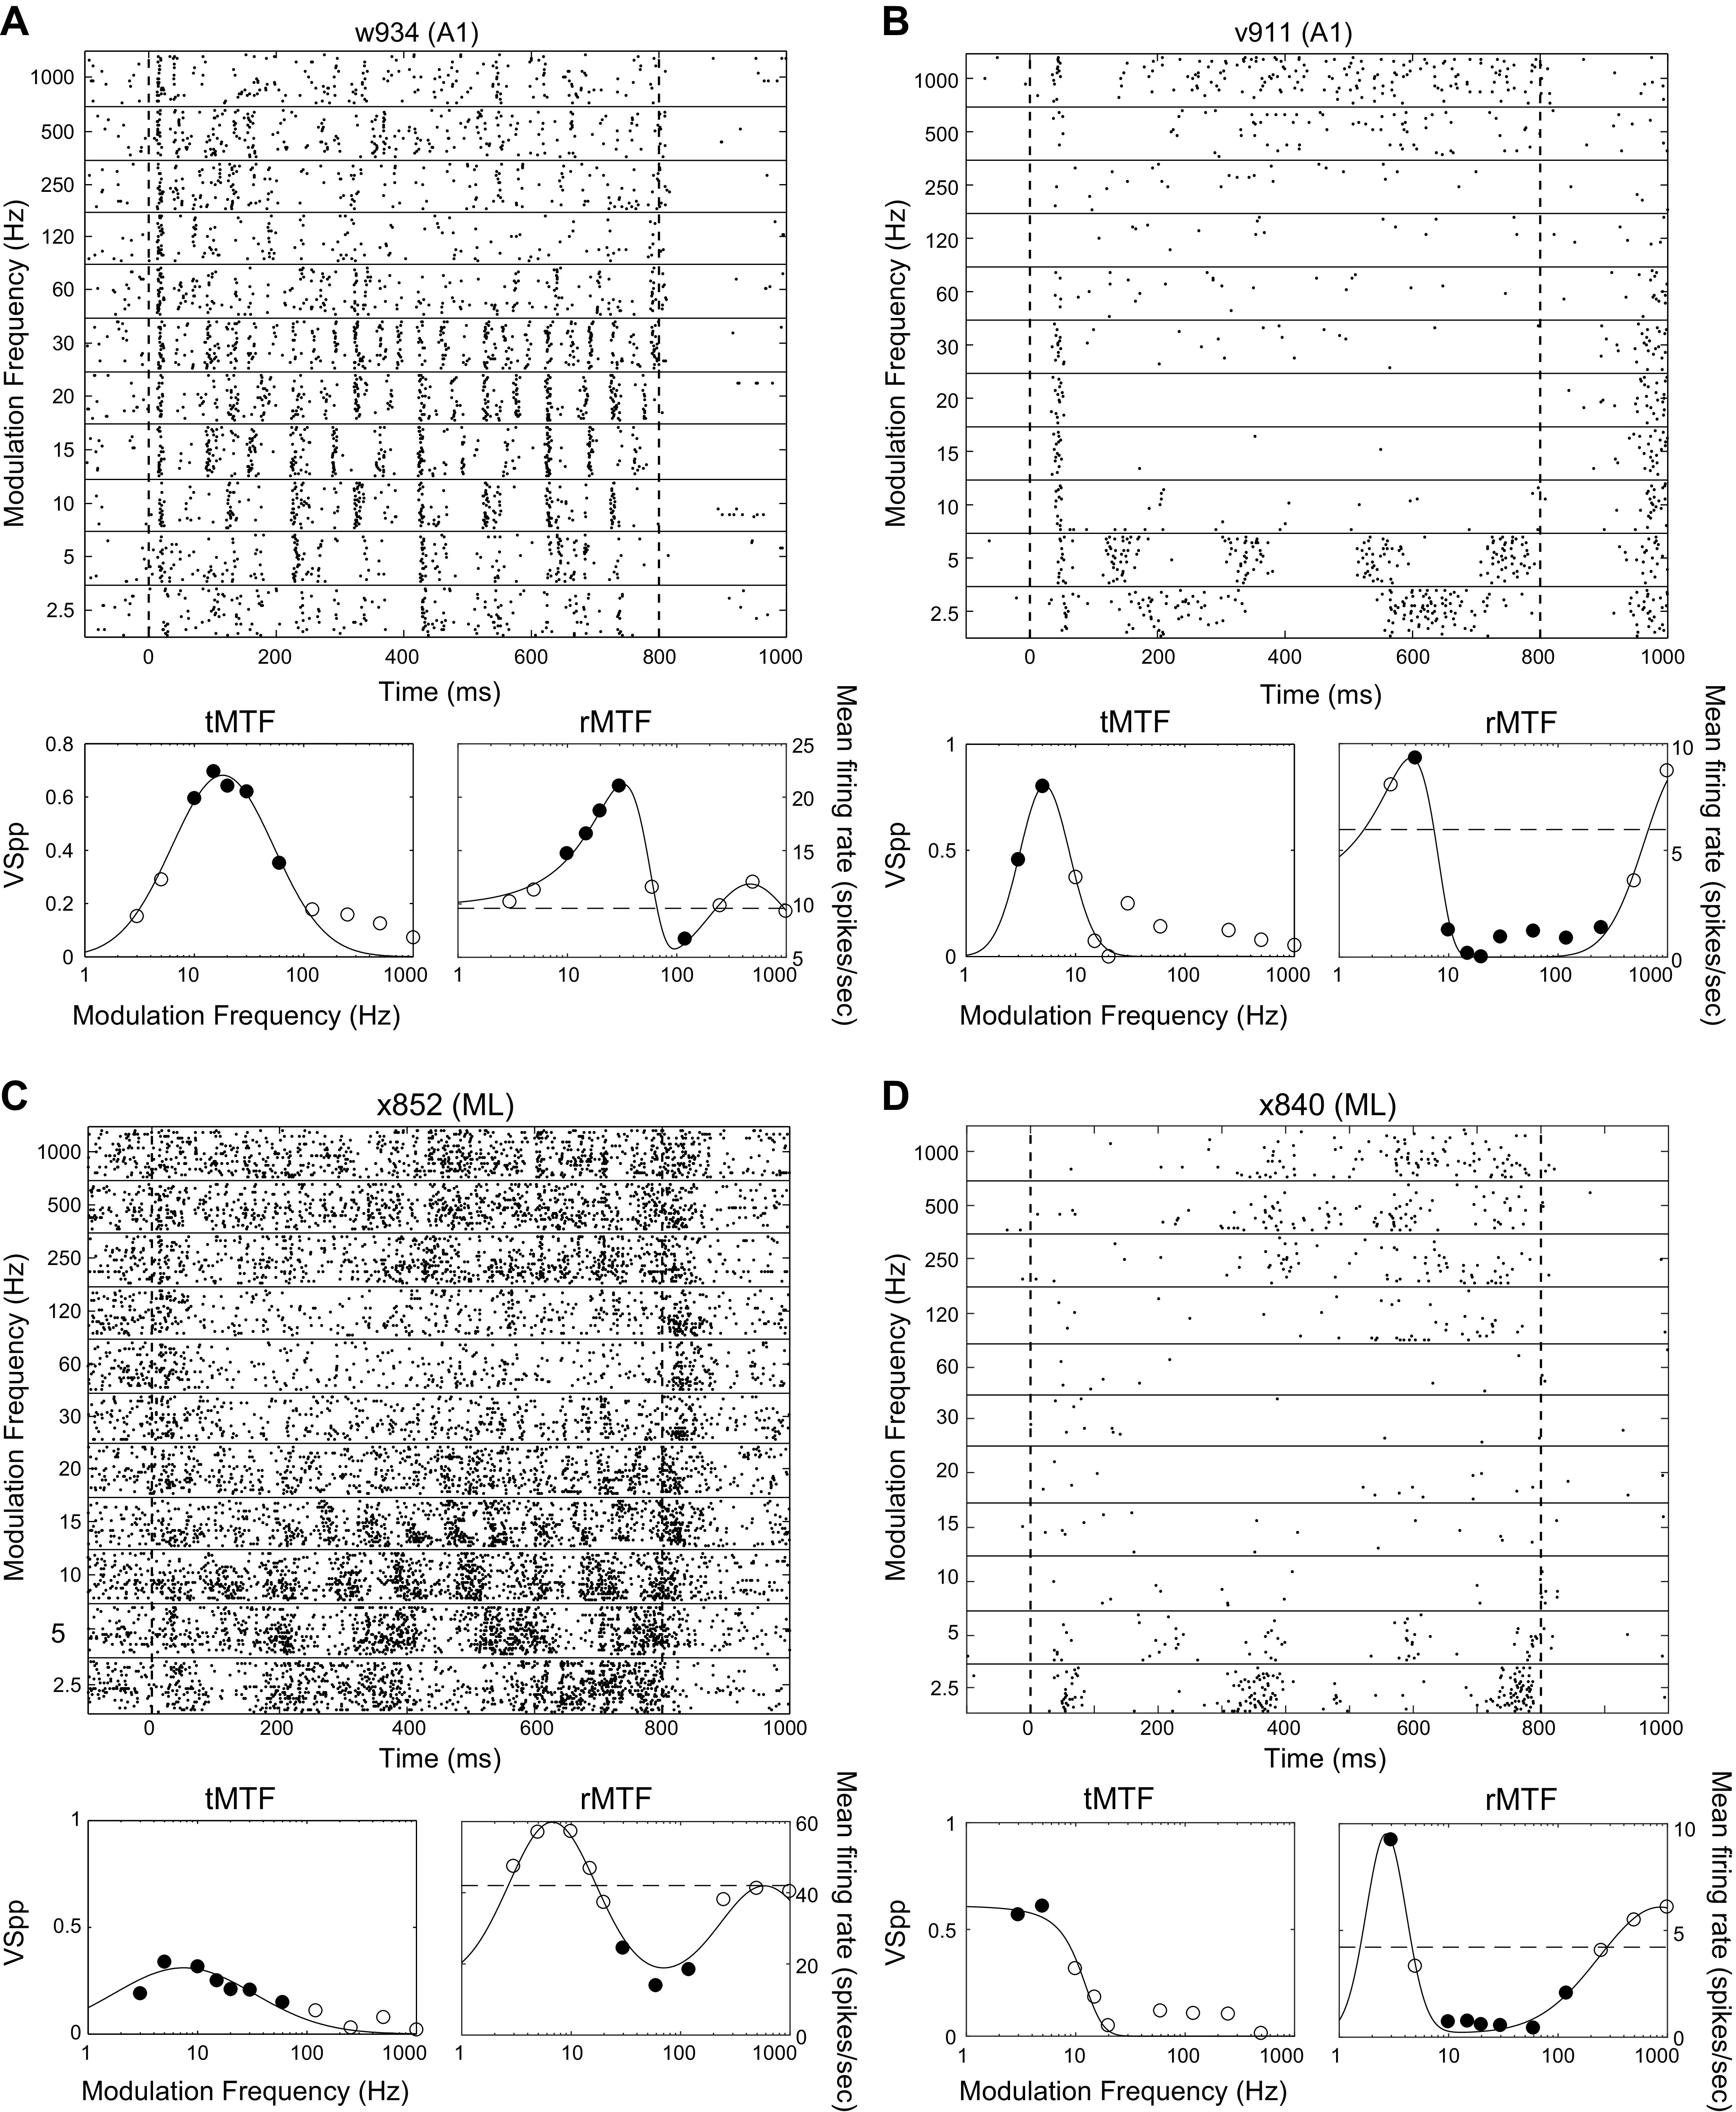
Example responses from peak/trough (P/T) cells. Plots as in Fig. 2. All examples are best fit by the P/T fit (see methods). Filled dots on the tMTFs indicate modulation frequencies at which there is significant phase locking (t test, P < 0.05 corrected for 11 comparisons). Filled dots on the rMTFs indicate modulation frequencies at which the firing rate differed from the firing rate to the unmodulated stimulus (t test, P < 0.05 corrected for 11 comparisons). Dashed line on rMTFs indicates the firing rate to the unmodulated stimulus. Neurons with significant firing rate differences both greater than the response to unmodulated noise at some MFs and less than the response to unmodulated noise at other MFs (A, B, and D) were classified as “mixed” in Table 2. The neuron in C only had significant firing rate differences that were less than the unmodulated noise response and was classified as “decreasing” in Table 2. BFs of cells depicted, by panel: A, 5.5 kHz; B, 11 kHz; C, 2.4 kHz; and D, 27 kHz. MF, modulation frequency; rMTF, rate-based modulation transfer function; tMTF, temporal-based modulation transfer function.