
Fig. 11.
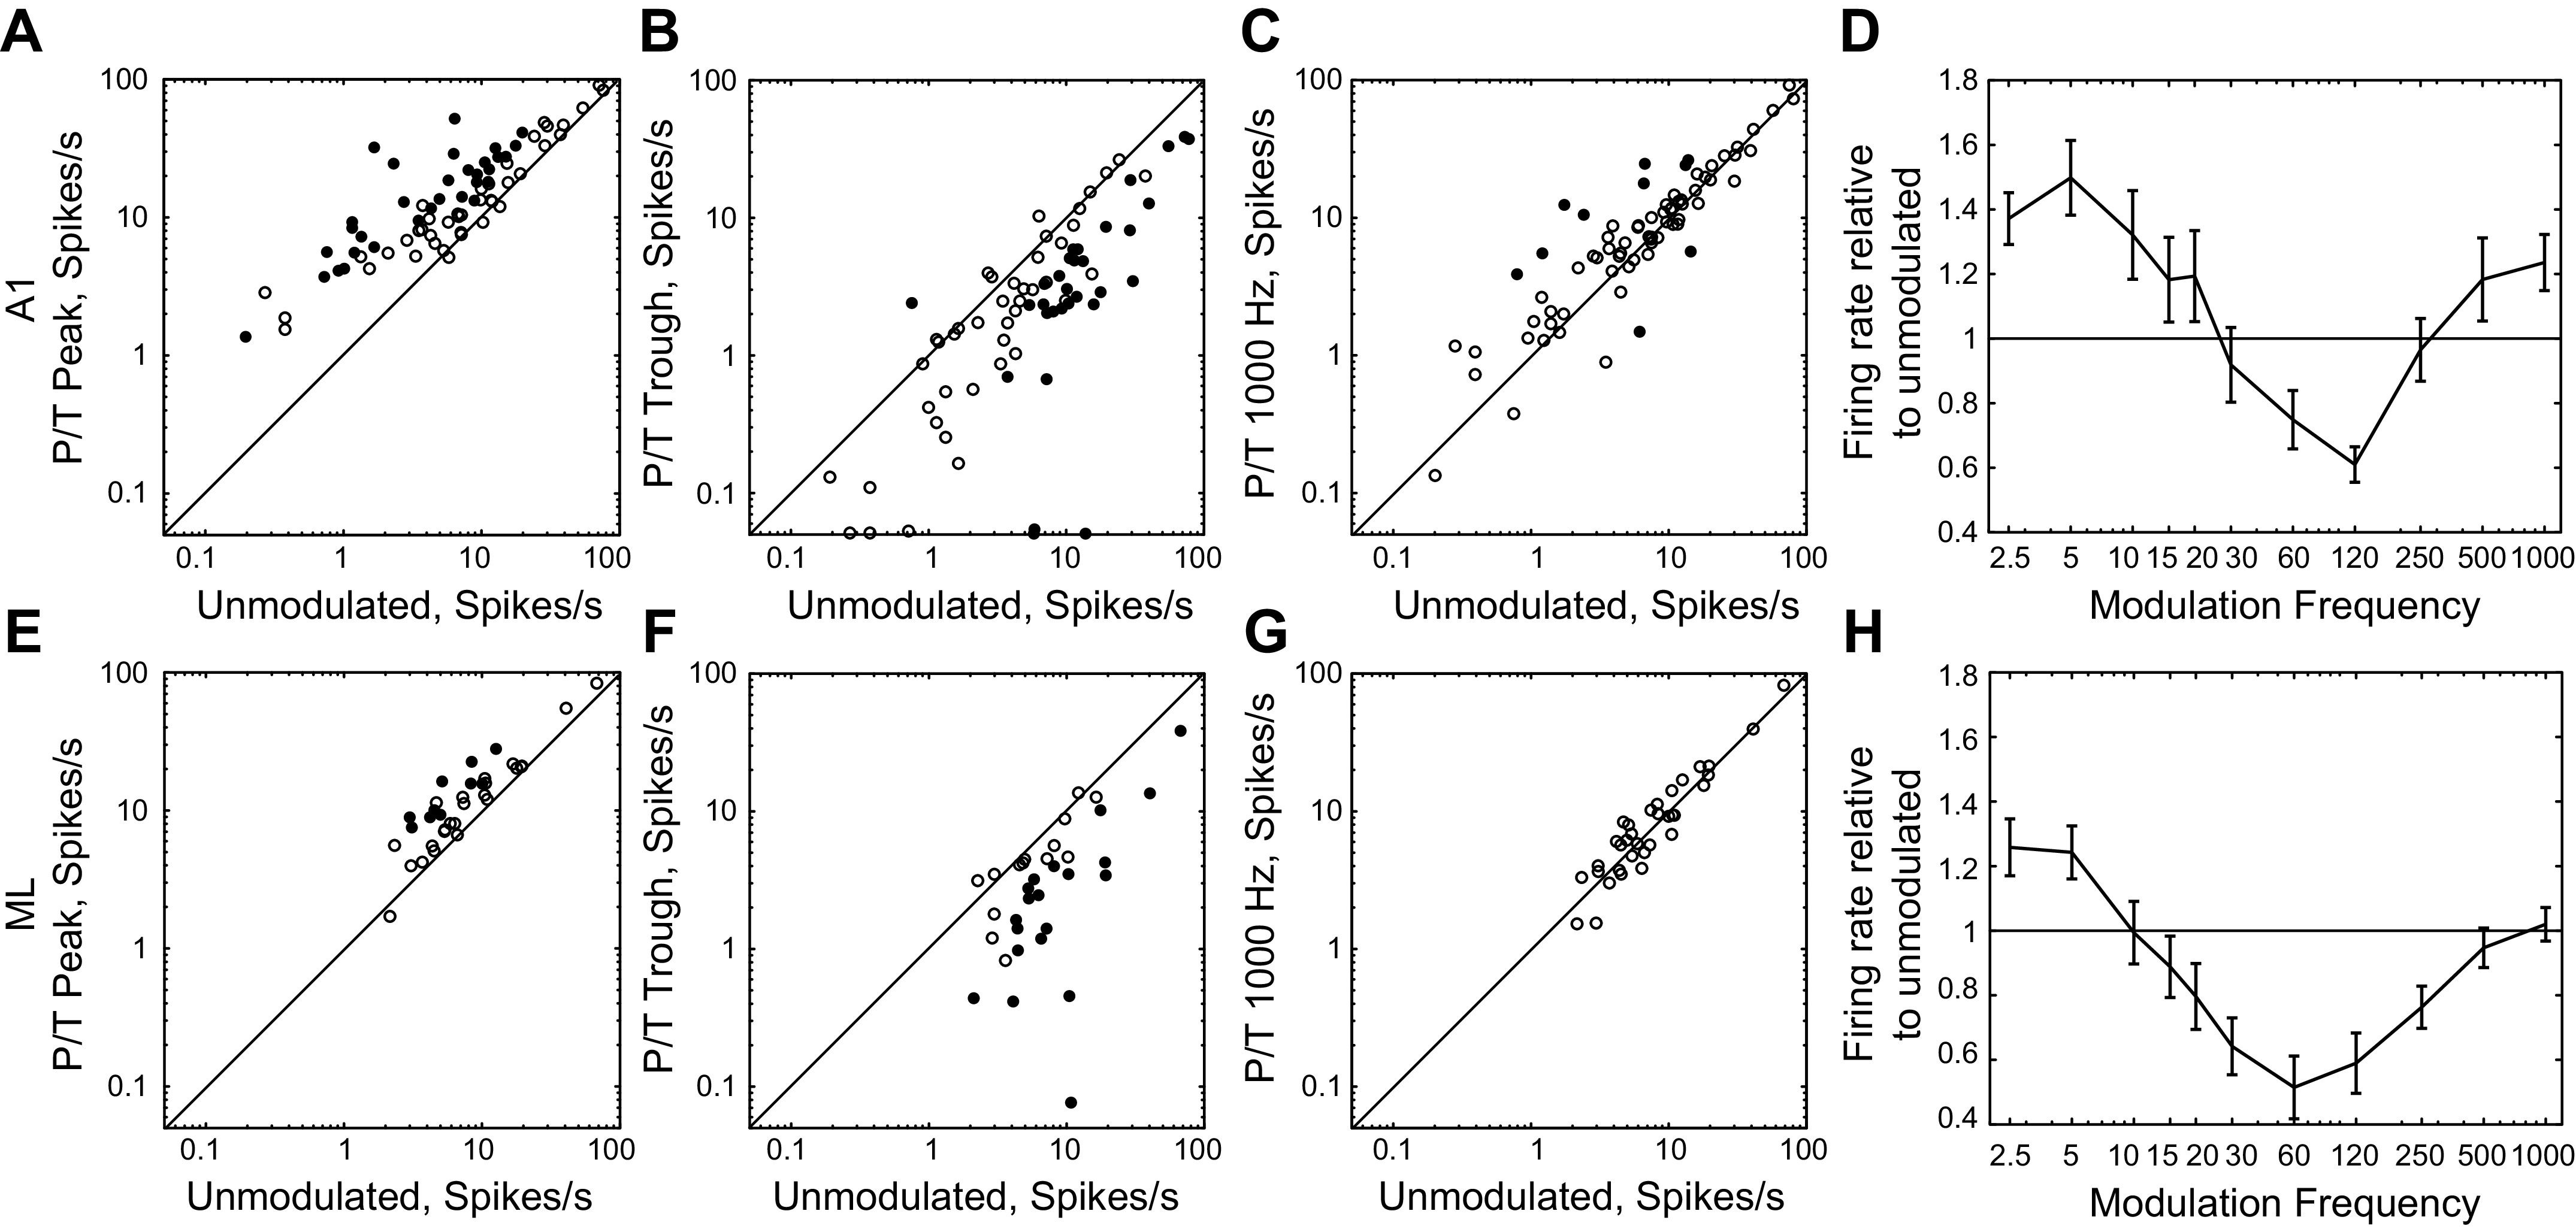
Firing rate relative to the response to unmodulated noise at low-frequency peak, middle-frequency trough, and high MF region. A–C, E–G: cell-by-cell scatter of firing rate to unmodulated noise (x-axis) against firing rate to AM for various conditions. Top row, A1. Bottom row, ML. A and E: firing rate of peak/trough (P/T) cells at the first P/T peak. B and F: firing rate of P/T cells at the P/T trough. C and G: firing rate of P/T cells at the 1,000 Hz modulation frequency (MF). Closed symbols represent cells for which the two firing rates significantly differ (t test, P < 0.05 after correction for multiple comparisons). Open symbols represent cells for which firing rates do not significantly differ. Diagonal line is a unity line. D and H: mean normalized rMTF of P/T cells (calculated as the geometric mean of P/T rMTFs normalized by their respective firing rate to unmodulated stimuli; error bars are standard error of the geometric mean). A1, primary auditory cortex; AM, amplitude-modulated; ML, middle lateral auditory cortex; rMTF, rate-based modulation transfer function.