
Fig. 12.
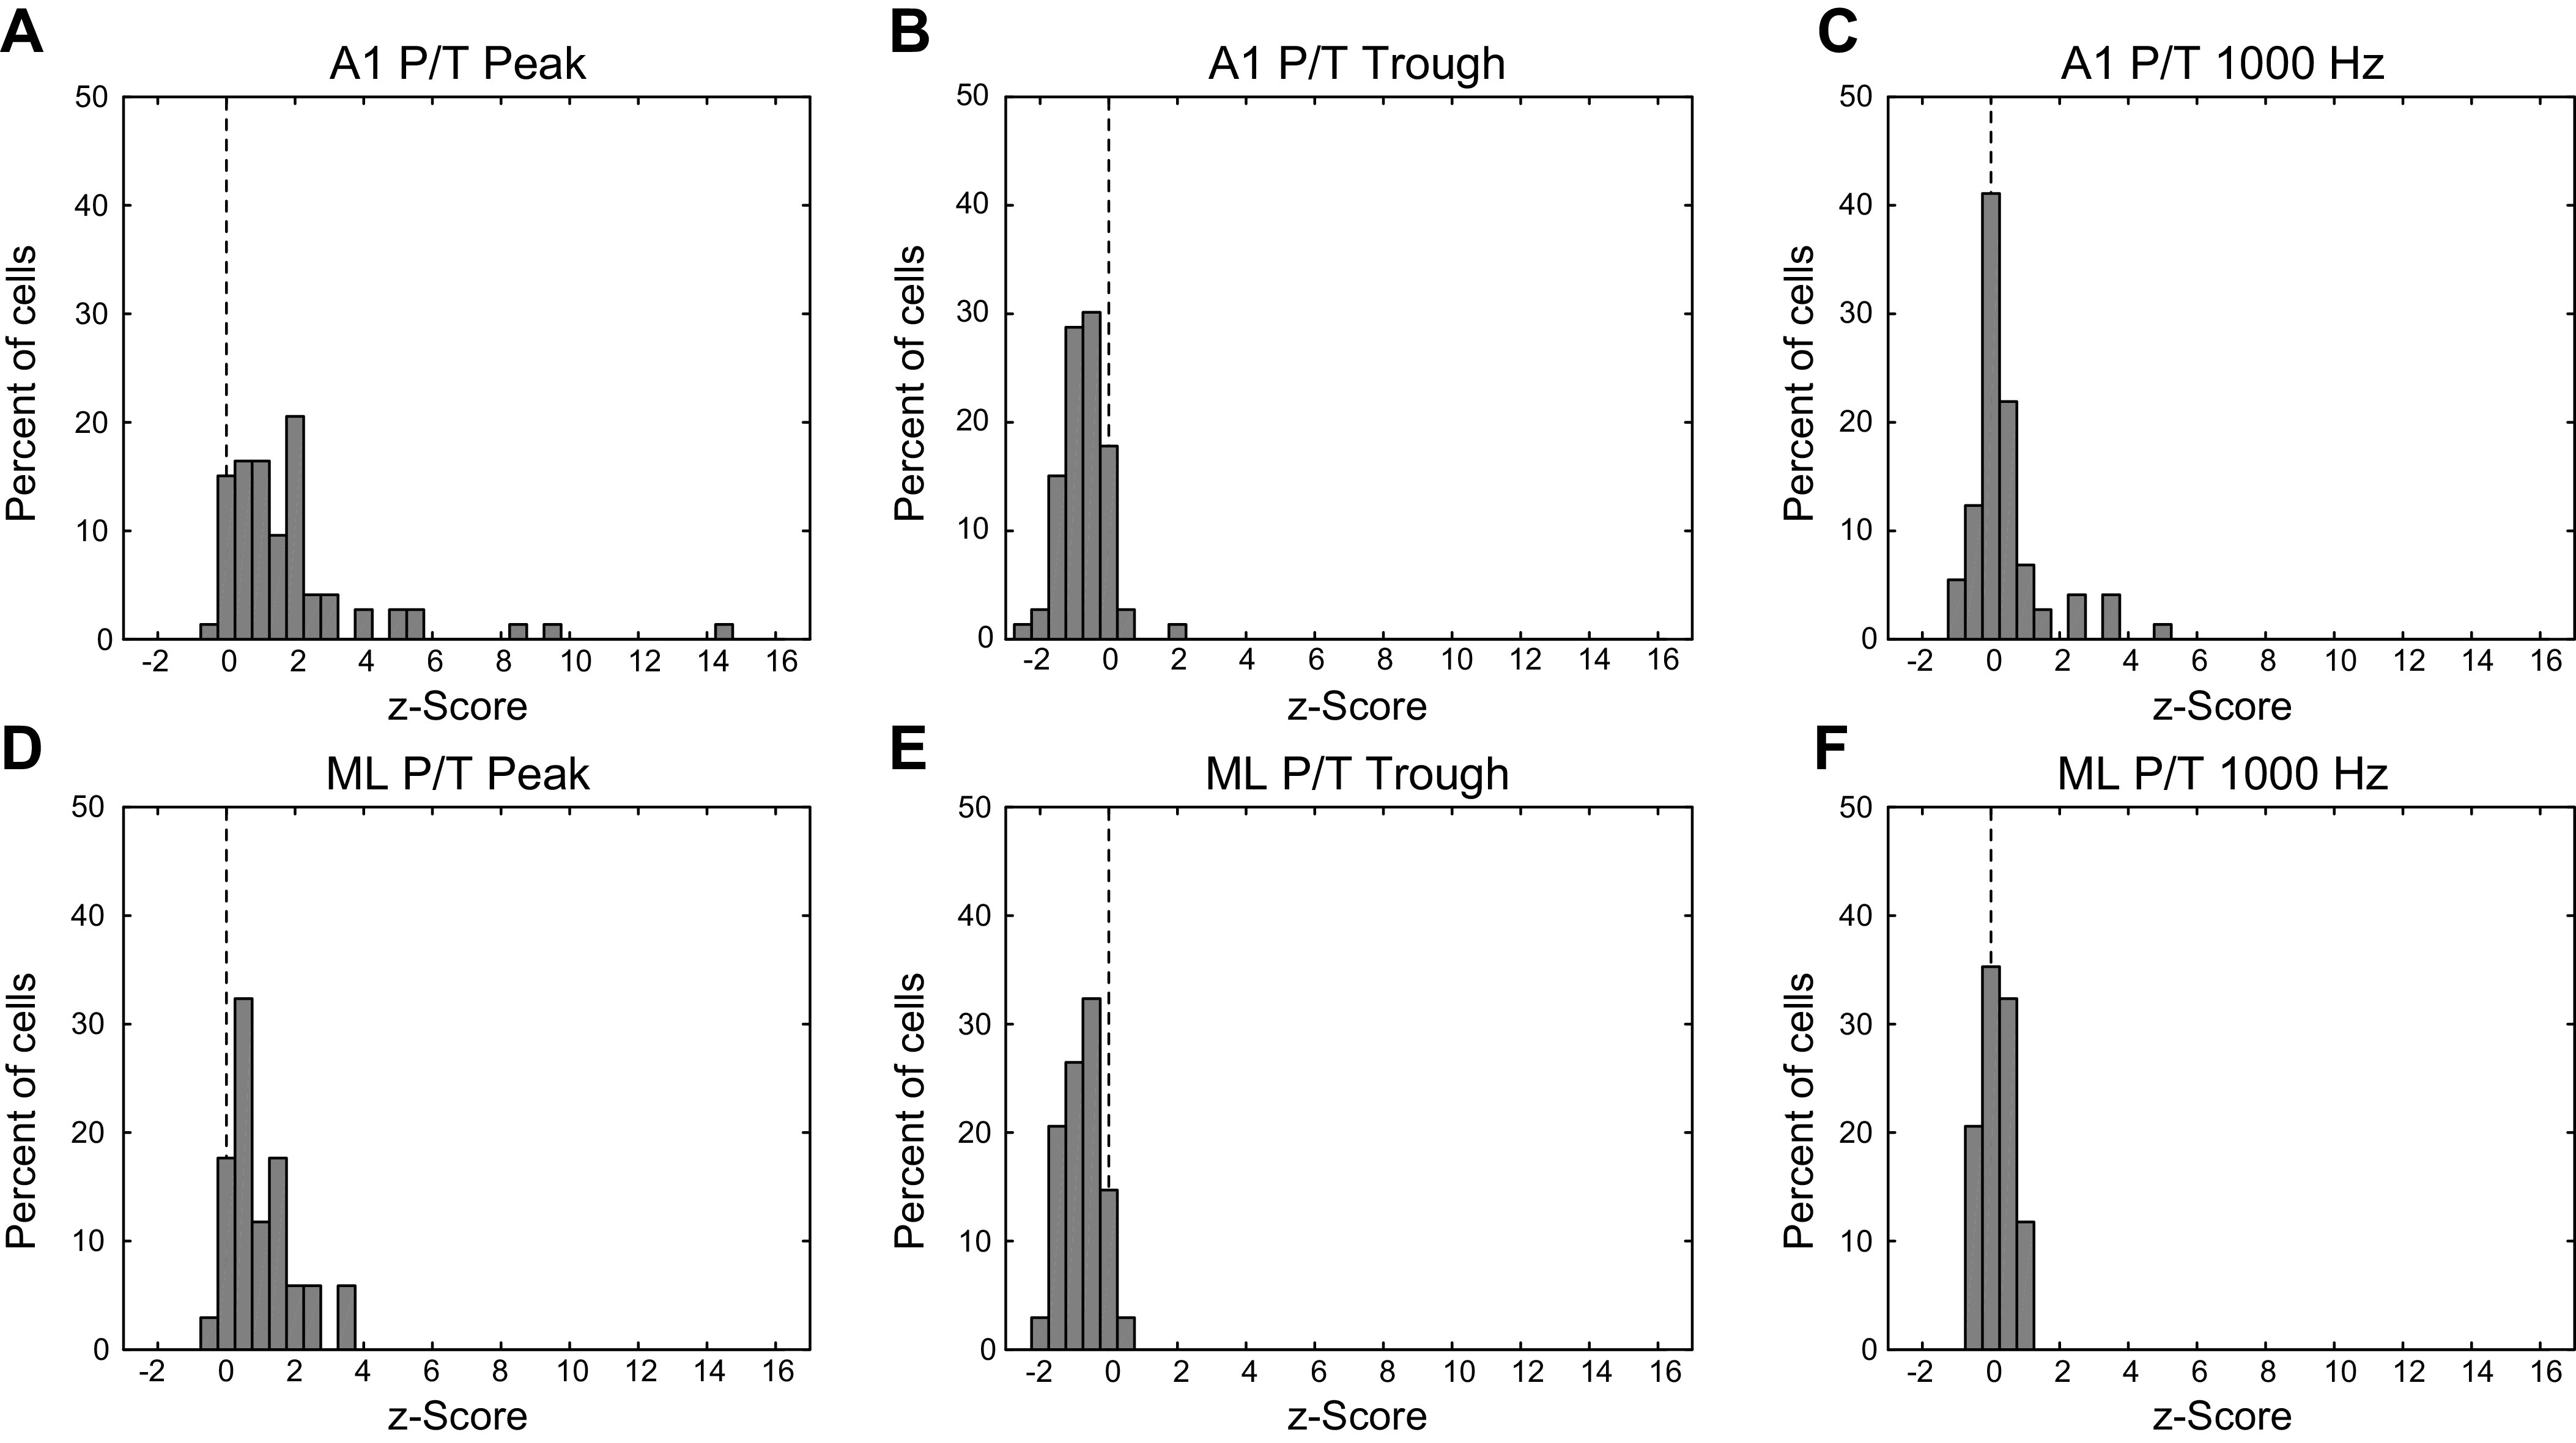
Firing rate z-scored with respect to the response to unmodulated noise at low-frequency peak, mid-frequency trough, and high MF. Top row (A–C) is A1, bottom row (D–F) is ML. Left column, firing rate for peak/trough (P/T) cells at low-MF peak, z-scored with respect to the response to unmodulated noise. Middle column, same as left column, for P/T cell firing rate at middle-MF trough. Right column, same as left column, for P/T cell firing rate at 1,000 Hz. A1, primary auditory cortex; MF, modulation frequency; ML, middle lateral auditory cortex.