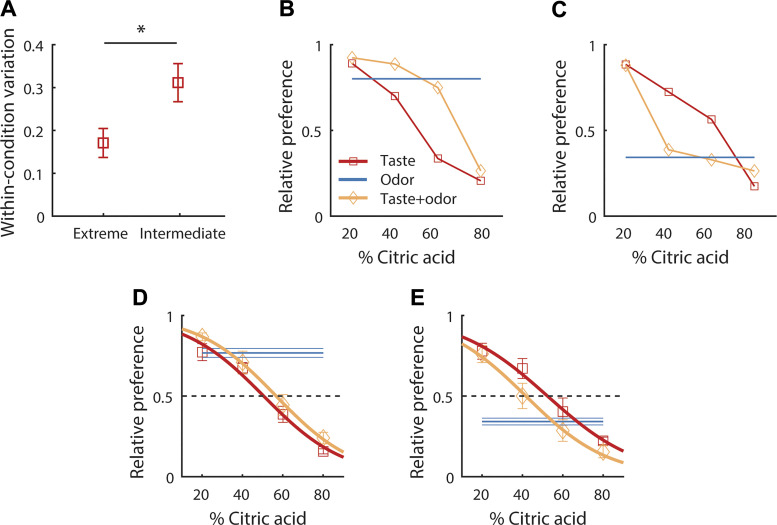
Fig. 1.
A: means (±SE) deviation between taste-only preferences obtained from two repetitions of the same condition [pooled across intermediate (40%/60%, 60%/40%) and extreme (20%/80%, 80%/20%) taste-only conditions]. B–E: flavor choice behavior in taste (red squares), odor (blue), and mixture (yellow diamonds) conditions. Preferences (relative to control) as a function of citric acid content for one example animal that preferred odor H (B), and one example animal that preferred odor L (C), as well as the means (±SE) preferences over all animals that preferred odor H (n = 12) (D) and odor L (n = 4) (E). Lines in D and E show logistic regression. Results from t test as described in the text is indicated above (A) (*P < 0.05).

