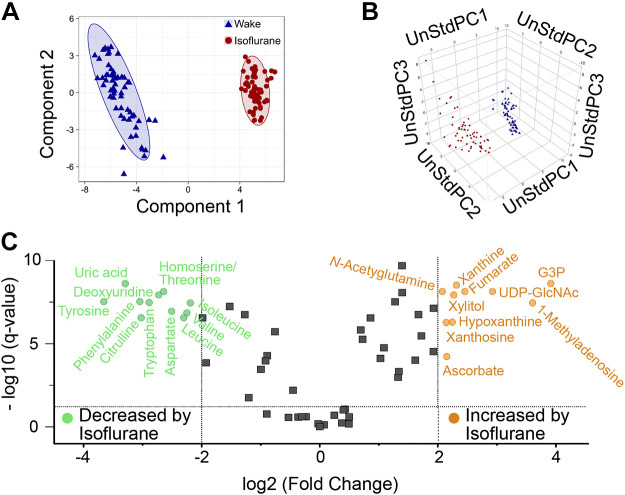
Fig. 3.
Summary of multivariate analyses for the 61 shared metabolites. A: each symbol in the partial least squares discriminate analysis (PLS-DA) score plot shows data from one dialysis sample collected during wakefulness (blue triangles, n = 60 samples) or isoflurane anesthesia (red circles, n = 60 samples). Ellipses define the 95% confidence interval for the state-space distribution of metabolites. B: fuzzy k-means cluster analysis on principal component analyses scores confirmed the PLS-DA distribution. The 120 points represent dialysis samples obtained during isoflurane anesthesia (red) or wakefulness (blue). Axes show unstandardized principle components (UnStdPC). C: volcano plot indicates fold change ≥ 4 and q < 0.0001 during anesthesia relative to wakefulness for molecules decreased by isoflurane (green, n = 11) or increased by isoflurane (orange, n = 10). Fold changes were calculated using median values in Supplemental Table S1 (https://figshare.com/s/42669ca81d5079678004). Points plotted in gray represent molecules (n = 40) that did not satisfy the q and fold change requirements.

