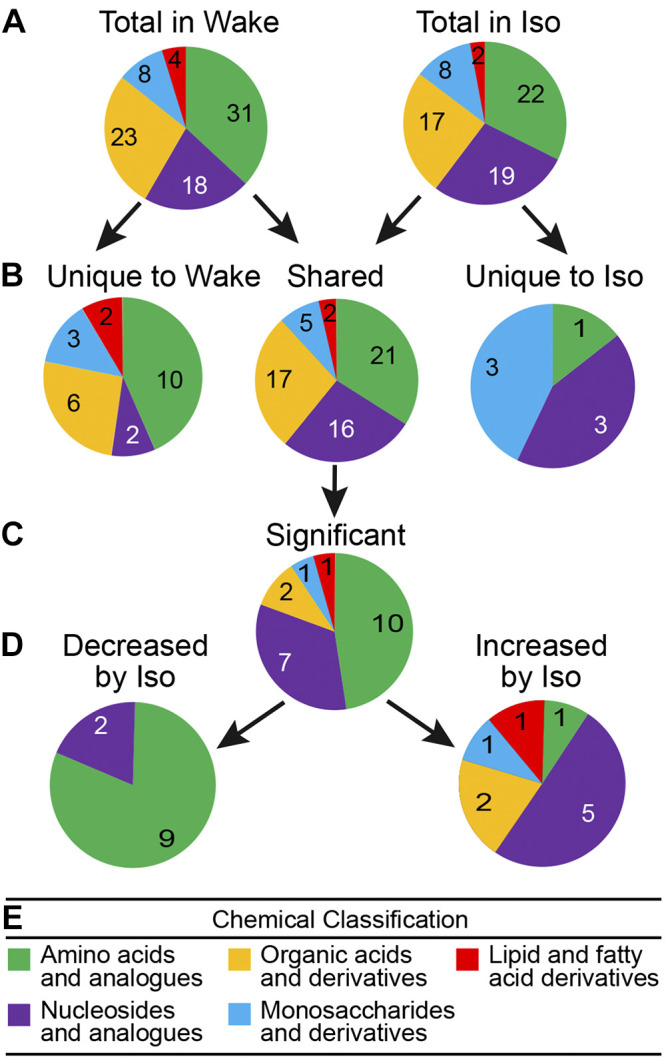
Fig. 4.

Pie charts schematize the general chemical taxonomy for all 91 molecules detected during wakefulness (Wake) and/or isoflurane anesthesia (Iso). Molecules were classified into 5 groups (see color key E) based on their closest direct/alternate parents in the Human Metabolome Database. Numbers of metabolites corresponding to the key categories are specified within each segment of the pie charts. A illustrates number and chemical classification of molecules measured during wakefulness (left, n = 84) and isoflurane anesthesia (right, n = 68). B divides the 91 metabolites into chemical classes for those detected only during wakefulness (left, n = 23), only during isoflurane anesthesia (right, n = 7), and during both wakefulness and anesthesia (middle, n = 61). For a list of all metabolites measured during both wakefulness and isoflurane anesthesia see Supplemental Table S1 (https://figshare.com/s/42669ca81d5079678004). For a list of metabolites unique to wakefulness and unique to anesthesia see Supplemental Table S2 (https://figshare.com/s/104f004545d872edf924). C indicates chemical taxonomy of the 21 shared metabolites that showed a fold change ≥ 4 and q < 0.0001 These molecules are identified in Fig. 5. D divides the 21 significant, shared metabolites into those that were decreased (left, n = 11) and increased (right, n = 10) during isoflurane.
