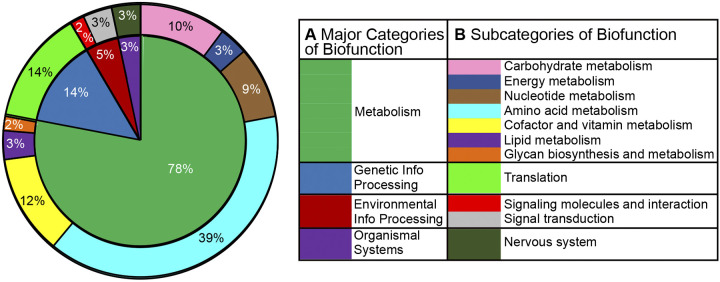
Fig. 6.
Major categories (inner circle) and subcategories (outer circle) of biofunction from Kyoto Encyclopedia of Genes and Genomes (KEGG) database. Circle plot represents the metabolites (n = 21) with levels that were significantly changed (fold change ≥ 4, q < 0.0001) during isoflurane anesthesia. Percentages within the plot indicate the total number of times the 21 molecules were identified in a KEGG pathway; e.g., molecules associated with amino acid metabolism comprised 23 of 59 pathway occurrences, or 39%. A shows the 4 major categories of biofunction illustrated by the inner circle; B lists 11 subcategories of biofunction identified by corresponding colors in the outer circle.

