Figure 7.

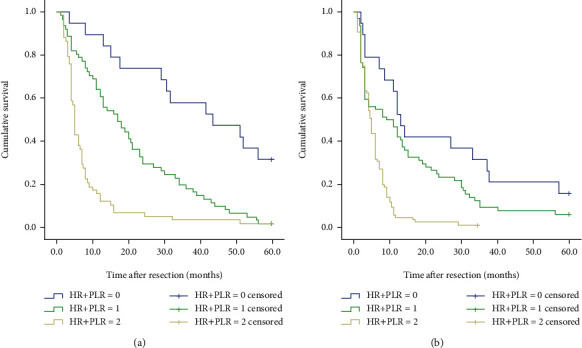
Kaplan–Meier curve for OS (overall survival) of GCLM patients stratified by HR+PLR: (a) 138 GCLM patients undergoing postoperative chemotherapy (P < 0.001); (b) 168 GCLM patients without postoperative chemotherapy (P < 0.001).

Kaplan–Meier curve for OS (overall survival) of GCLM patients stratified by HR+PLR: (a) 138 GCLM patients undergoing postoperative chemotherapy (P < 0.001); (b) 168 GCLM patients without postoperative chemotherapy (P < 0.001).