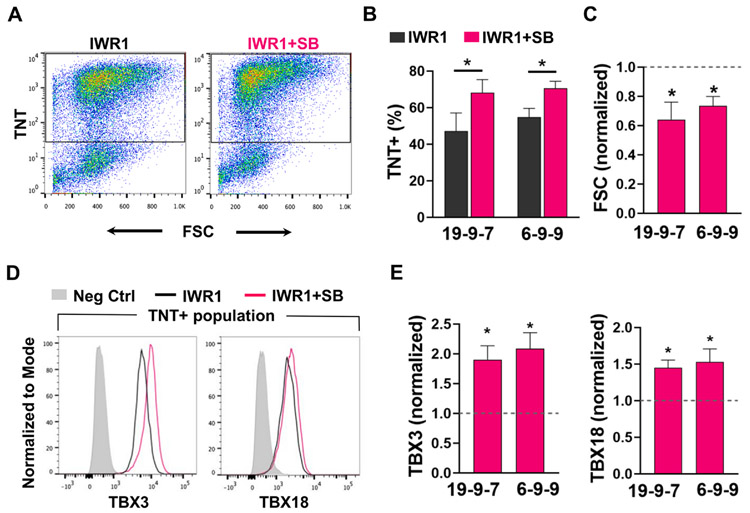
Fig. 4. CM yield and phenotype from the IWR1+SB differentiation.
A) Representative flow cytometry plots of troponin T (TNT) vs. forward scatter (FSC) for cells differentiated from the IWR1+SB vs. the IWR1 condition. B) Differentiation yield of TnT+ cells from the IWR1+SB and the control IWR1 differentiation of hiPSC lines iPS-DF19-9-7T (n = 9) and iPSF-DF6-9-9T (n = 17). C) FSC for hiPSC-CMs differentiated from the IWR1+SB condition normalized to the IWR1 control (dotted line) for two hiPSC lines. D) Representative histograms of TBX3 and TBX18 expression in the IWR1+SB- vs. IWR1-differentiated hiPSC-CMs (identified as TNT + cells). E) Bar graphs of TBX3 and TBX18 expression from CMs of independently differentiated batches by IWR1+SB relative to the IWR1 control (shown by dotted line) from two hiPSC lines (n = 4 for iPS-DF19-9-7T and n = 7 for iPS-DF6-9-9T). Data are shown as mean ± SEM. * denotes p < 0.05.

