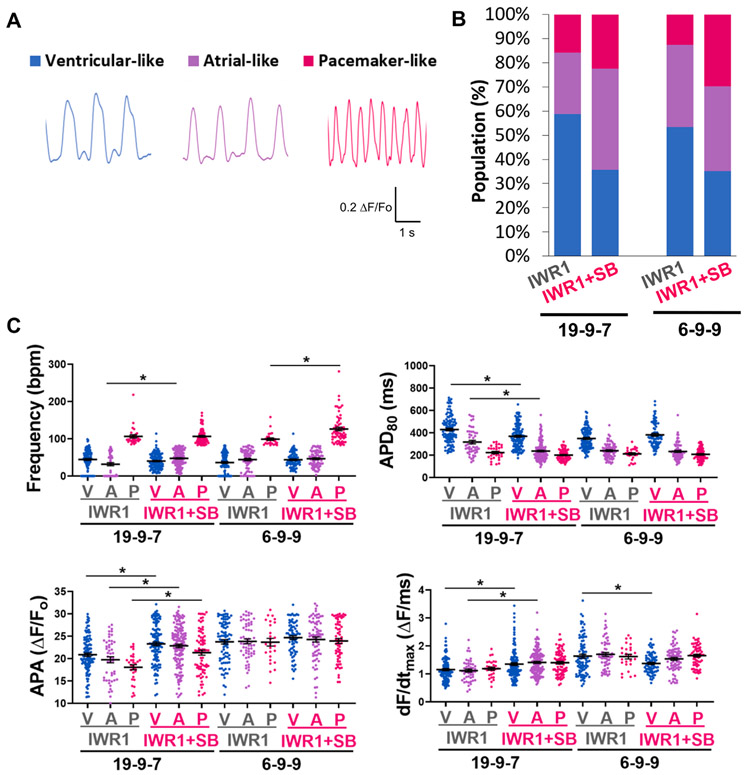
Fig. 6. Electrophysiological phenotype of the IWR1+SB-differentiated hiPSC-CMs from optical recordings of action potentials.
A) Representative AP traces of ventricular-like, atrial-like, and pacemaker-like subtypes recorded optically using FluoVolt in day ~60 hiPSC-CMs. B) CM subtype distribution of IWR1+SB-differentiated cultures relative to the control for two hiPSC lines, iPS-DF19-9-7T (IWR1: n = 189, IWR1+SB: n = 338) and iPS-DF6-9-9T (IWR1: n = 206, IWR1+SB: n = 208), pooled from two independently differentiated batches for each line. C) Frequency of automaticity, AP duration at 80% repolarization (APD80), AP amplitude (APA), and maximum rate of rise (dF/dtmax) quantified from optically recorded APs of hiPSC-CMs differentiated by the addition of IWR1+SB compared to the IWR1 control from iPS-DF19-9-7T and iPS-DF6-9-9T lines. Data are shown as mean ± SEM. * denotes p < 0.05.

