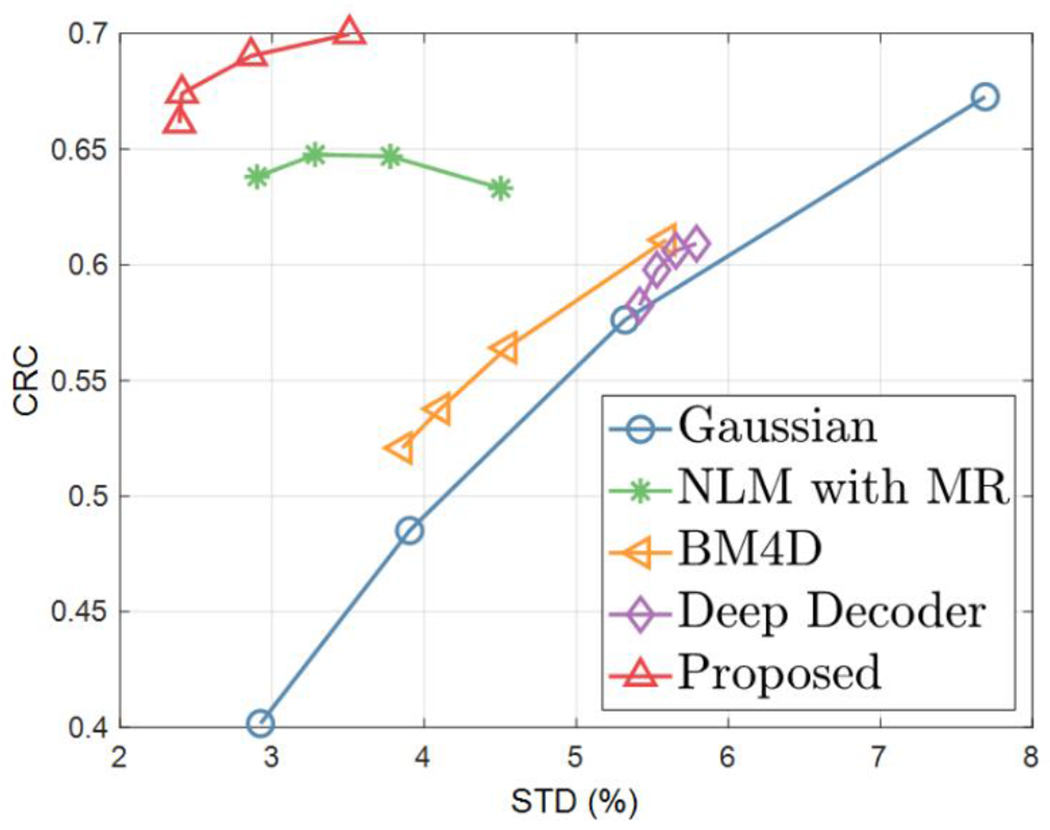
Figure 3.

The CRC-STD curves, between the gray matter region and the white matter region for the simulation study. Markers are generated for different FWHM (1.5, 2.5, 3.5, 4.5 pixels) of Gaussian, different window size (5, 7, 9, 11 pixels) of NLM, different noise standard deviation (40, 50, 60, 70 percentages) of BM4D, different epochs (2000, 2600, 3200, 3800) of Deep Decoder and different epochs (150, 200, 220, 250) of the proposed method.
