
Figure 6.
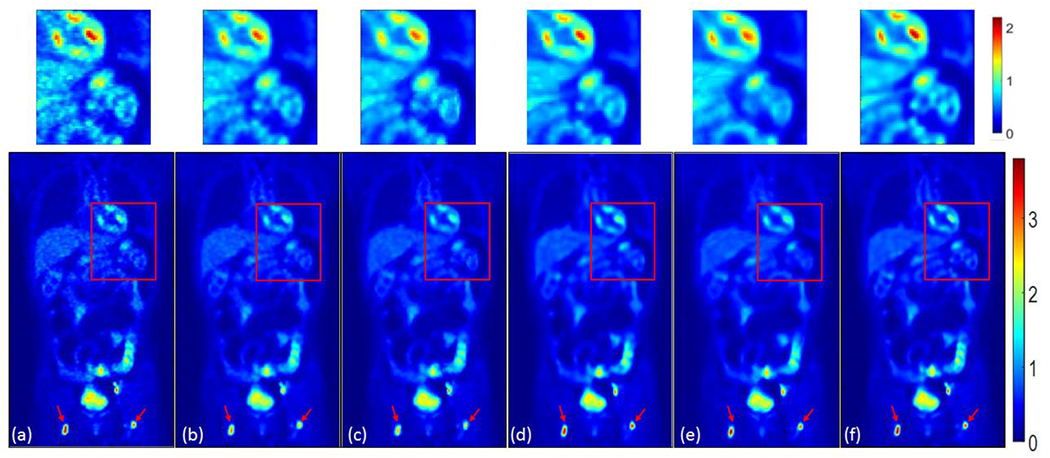
Coronal view of (a) the original noisy PET image; (b) the post-processed image using the Gaussian filter with FWHM = 1.6 pixel; (c) the post-processed image using the NLM filter guided by MR with window size 5×5×5; (d) the post-processed PET image using the BM4D method with 8 percent noise standard deviation; (e) the post-processed PET image using the Deep Decoder method with 2000 epochs; (f) the post-processed PET image using the proposed method trained with 700 epochs. Tumors are pointed out using arrows. Details in the red box are zoomed-in and shown above the whole-body images using a different color bar with the maximum value of 2.2.