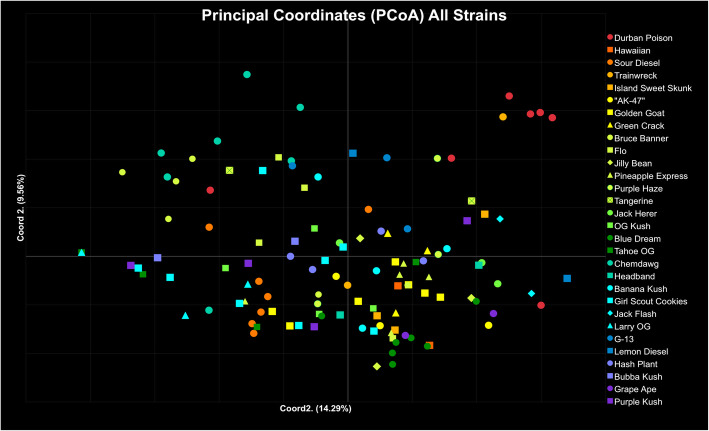
Fig. 2.
Principal Coordinates Analysis (PCoA) generated in GENALEX using Nei’s genetic distance matrix. Samples are a color-coded continuum by proportion of Sativa (Table 1) with the strain name given for each sample: Sativa type (red: 100% Sativa proportion, Hybrid type (dark green:50% Sativa proportion), and Indica type (purple: 0% Sativa proportion). Different symbols are used to indicate different strains within reported phenotype. Coordinate axis 1 explains 14.29% of the variation, coordinate axis 2 explains 9.56% of the variation, and Coordinate axis 3 (not shown) explains 7.07%

