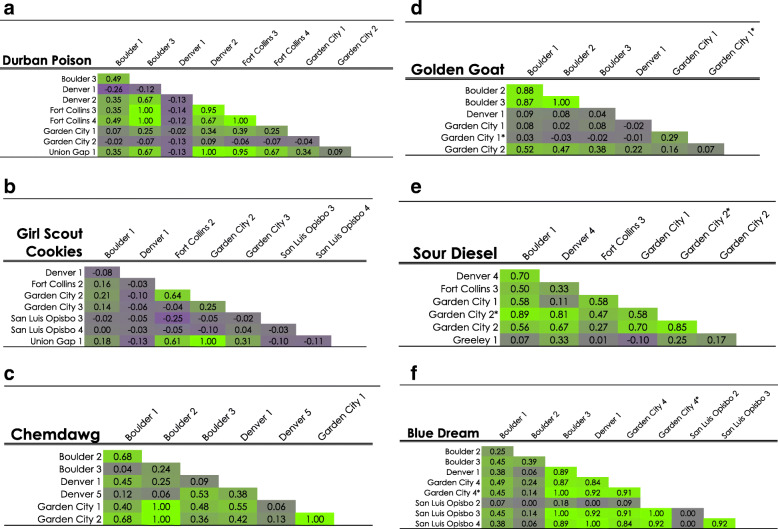
Fig. 3.
Heat maps of six prominent strains (a-f) using Lynch & Ritland (Faircloth 2008) pairwise genetic relatedness (r) values: purple indicates no genetic relatedness (minimum value -1.09) and green indicates a high degree of relatedness (maximum value 1.0). Sample strain names and location of origin are indicated along the top and down the left side of the chart. Pairwise genetic relatedness (r) values are given in each cell and cell color reflects the degree to which two individuals are related

