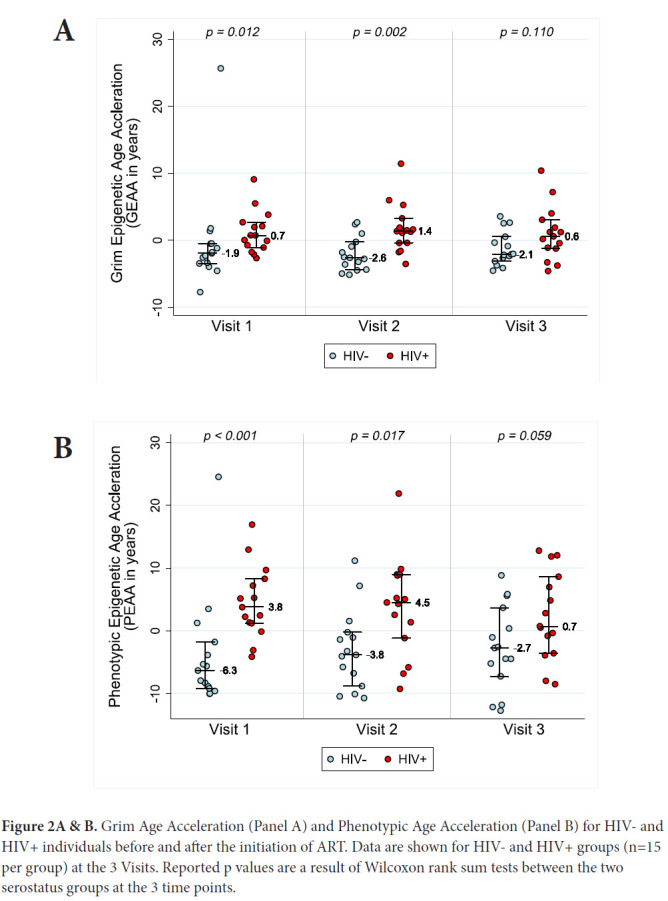
Figure 2A & B.

Grim Age Acceleration (Panel A) and Phenotypic Age Acceleration (Panel B) for HIV- and HIV+ individuals before and after the initiation of ART. Data are shown for HIV- and HIV+ groups (n=15 per group) at the 3 Visits. Reported p values are a result of Wilcoxon rank sum tests between the two serostatus groups at the 3 time points.
