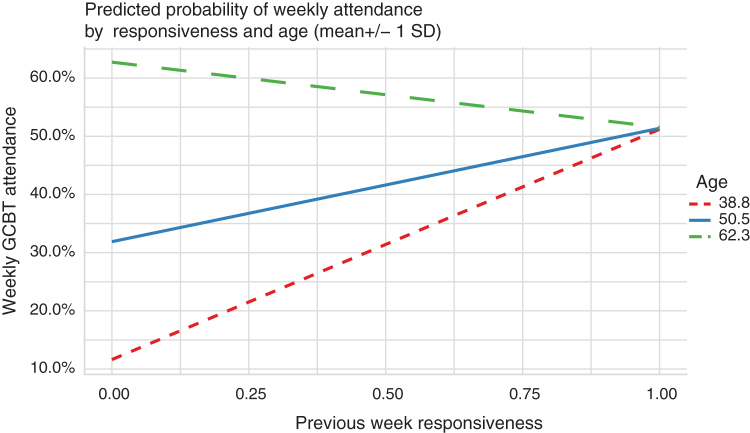
Fig. 2.
For illustrative purposes, we plot the marginal effects of the regression model. This plot shows the predicted probabilities for the response of the model of the association between previous week responsiveness and GCBT attendance by age (mean ± 1 SD). Confidence intervals are based on standard errors. Color images are available online.

