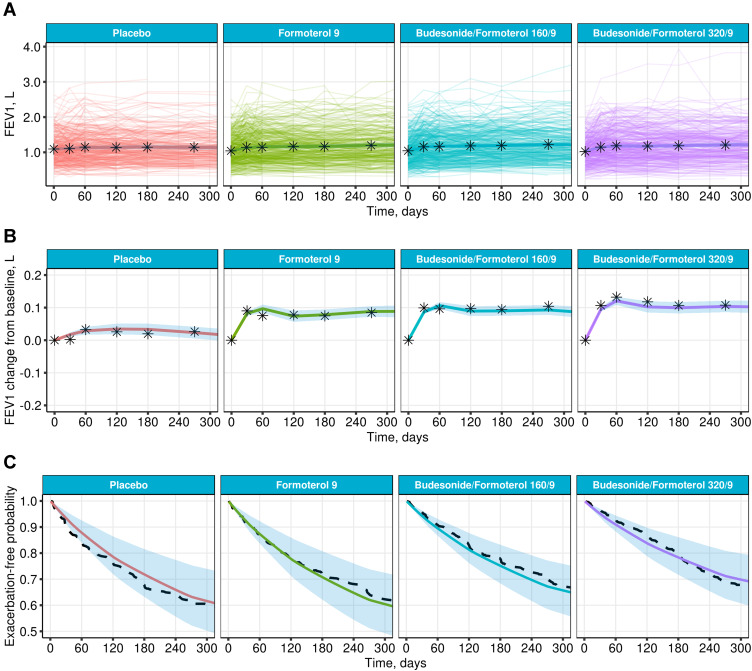
Figure 2.
Diagnostics of the joint model for prediction fitted to Study A. Mean of individual predictions of FEV1 (A) and change from baseline FEV1 (B) with 95% CI (solid colored lines and shaded areas), superimposed with individual profiles (thin colored lines) and means of the original data (stars) vs time. (C) Predicted mean exacerbation-free probabilities (solid line) with interquartile range (shaded area) and Kaplan–Meier estimates (dashed line).

