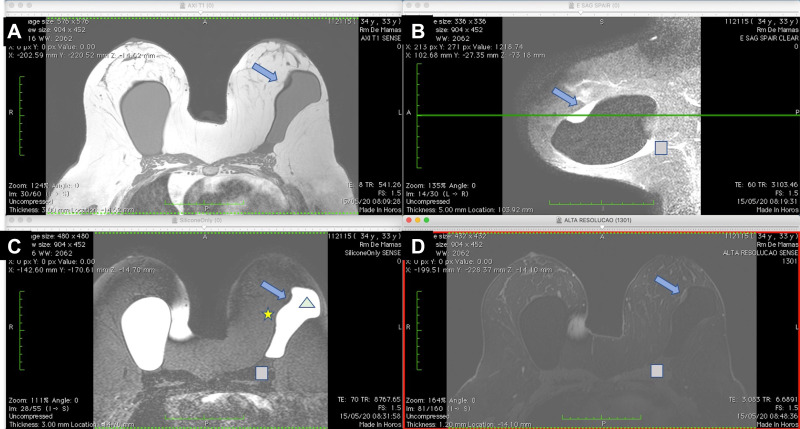
Figure 7.
(A–D) BMRI after breast adjuvant chemotherapy showing a T1-weighted sequence (A); T2 sequence with fat saturation (B); silicone-sensitive sequence (C); and image obtained after contrast enhancement (D). The silicone implant (light green triangle) is rotated (yellow asterisk) compared to Figure 9. However, this figure shows an intracapsular mass formation and late-contrast enhancement in the projection of the implant fractured area (arrow blue) compatible with SIGBIC. A small/intermediary intracapsular collection is observed (gray square).

