Figure 1.
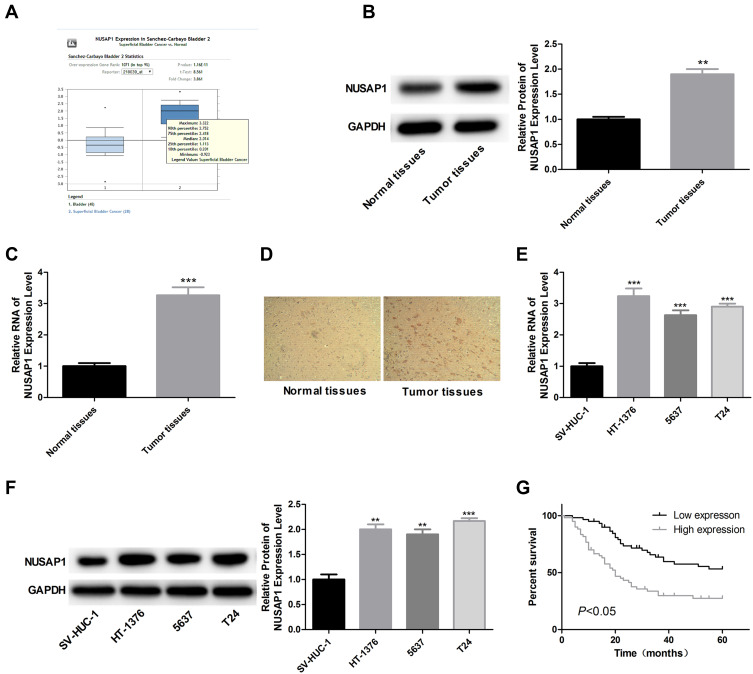
Overexpression of NUSAP1 in bladder cancer tissues and cells. (A) Oncomine database showing the expression level of NUSAP1 in bladder tissues (n=48) and superficial bladder cancer tissues (n=28) (P<0.001). (B and C) WB and RT-PCR was performed to determine the protein and mRNA levels of NUSAP1 in 25 paired bladder cancer tissues and tissues adjacent to cancer. One representative figure was shown. (n=25, **P<0.01, ***P<0.001, tumor tissues group vs normal tissues). (D) IHC was performed to detect NUSAP1 expression using an-NUSAP1 antibody. One representative figure was shown. (E and F) WB and RT-PCR was performed to determine the protein and mRNA levels of NUSAP1 in normal uroepithelium cell line SV-HUC-1 and bladder cancer cell line HT-1376, T24 and 5637. (n=3, **P<0.01, ***P<0.001, HT-1376, T24 and 5637 group vs SV-HUC-1 group). (G) Kaplan-Meier curve used to analysis the OS of bladder cancer patients with high (n=28) or low (n=32) expression of NUSAP1 (P<0.05).

