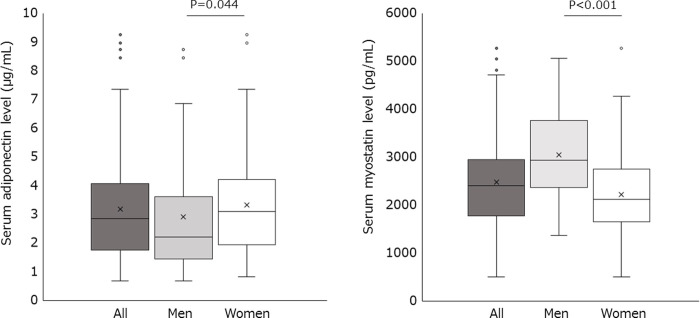
Fig 1. Serum adiponectin and myostatin levels in patients with obesity.
In these plots, lines within the boxes represent median values; the upper and lower lines of the boxes represent 25th and 75th percentiles, respectively; and the upper and lower bars outside the boxes represent the 90th and 10th percentiles, respectively.

