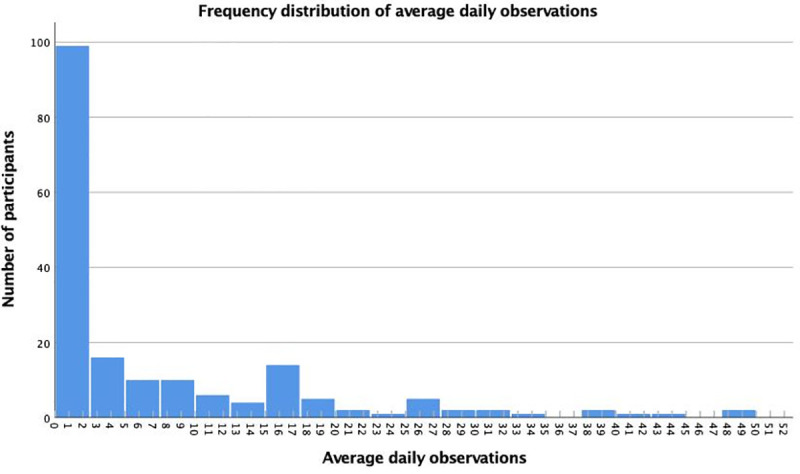
Fig 3. Frequency distribution of observations by young people.

The histogram presents how many average observations young volunteers contributed daily on iNaturalist. The right skewed shape of the graph shows the asymmetrical daily contributing pattern with a large number of participants (n = 81) contributing less than 1 observation daily while 12 participants contribute beyond average (>27 observations).
