
Fig. 1.
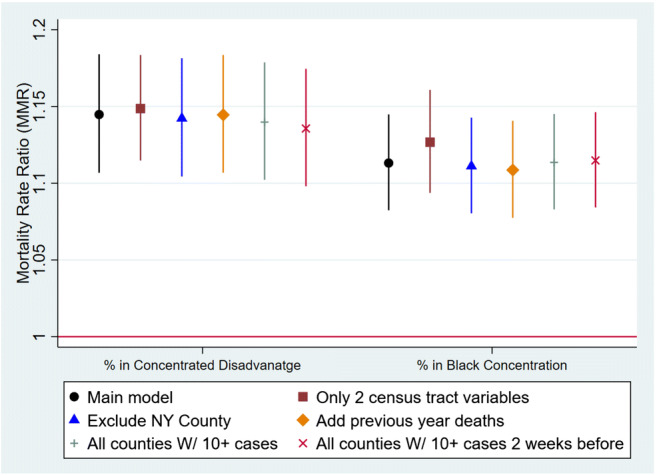
Mortality rate ratios (MRR) and 95% confidence intervals from the select models included in the sensitivity analysis. MRR can be interpreted as a percentage increase in the confirmed COVID-19 deaths with a 10% increase in the county population’s percentage residing in tracts with concentrated disadvantage or Black concentration