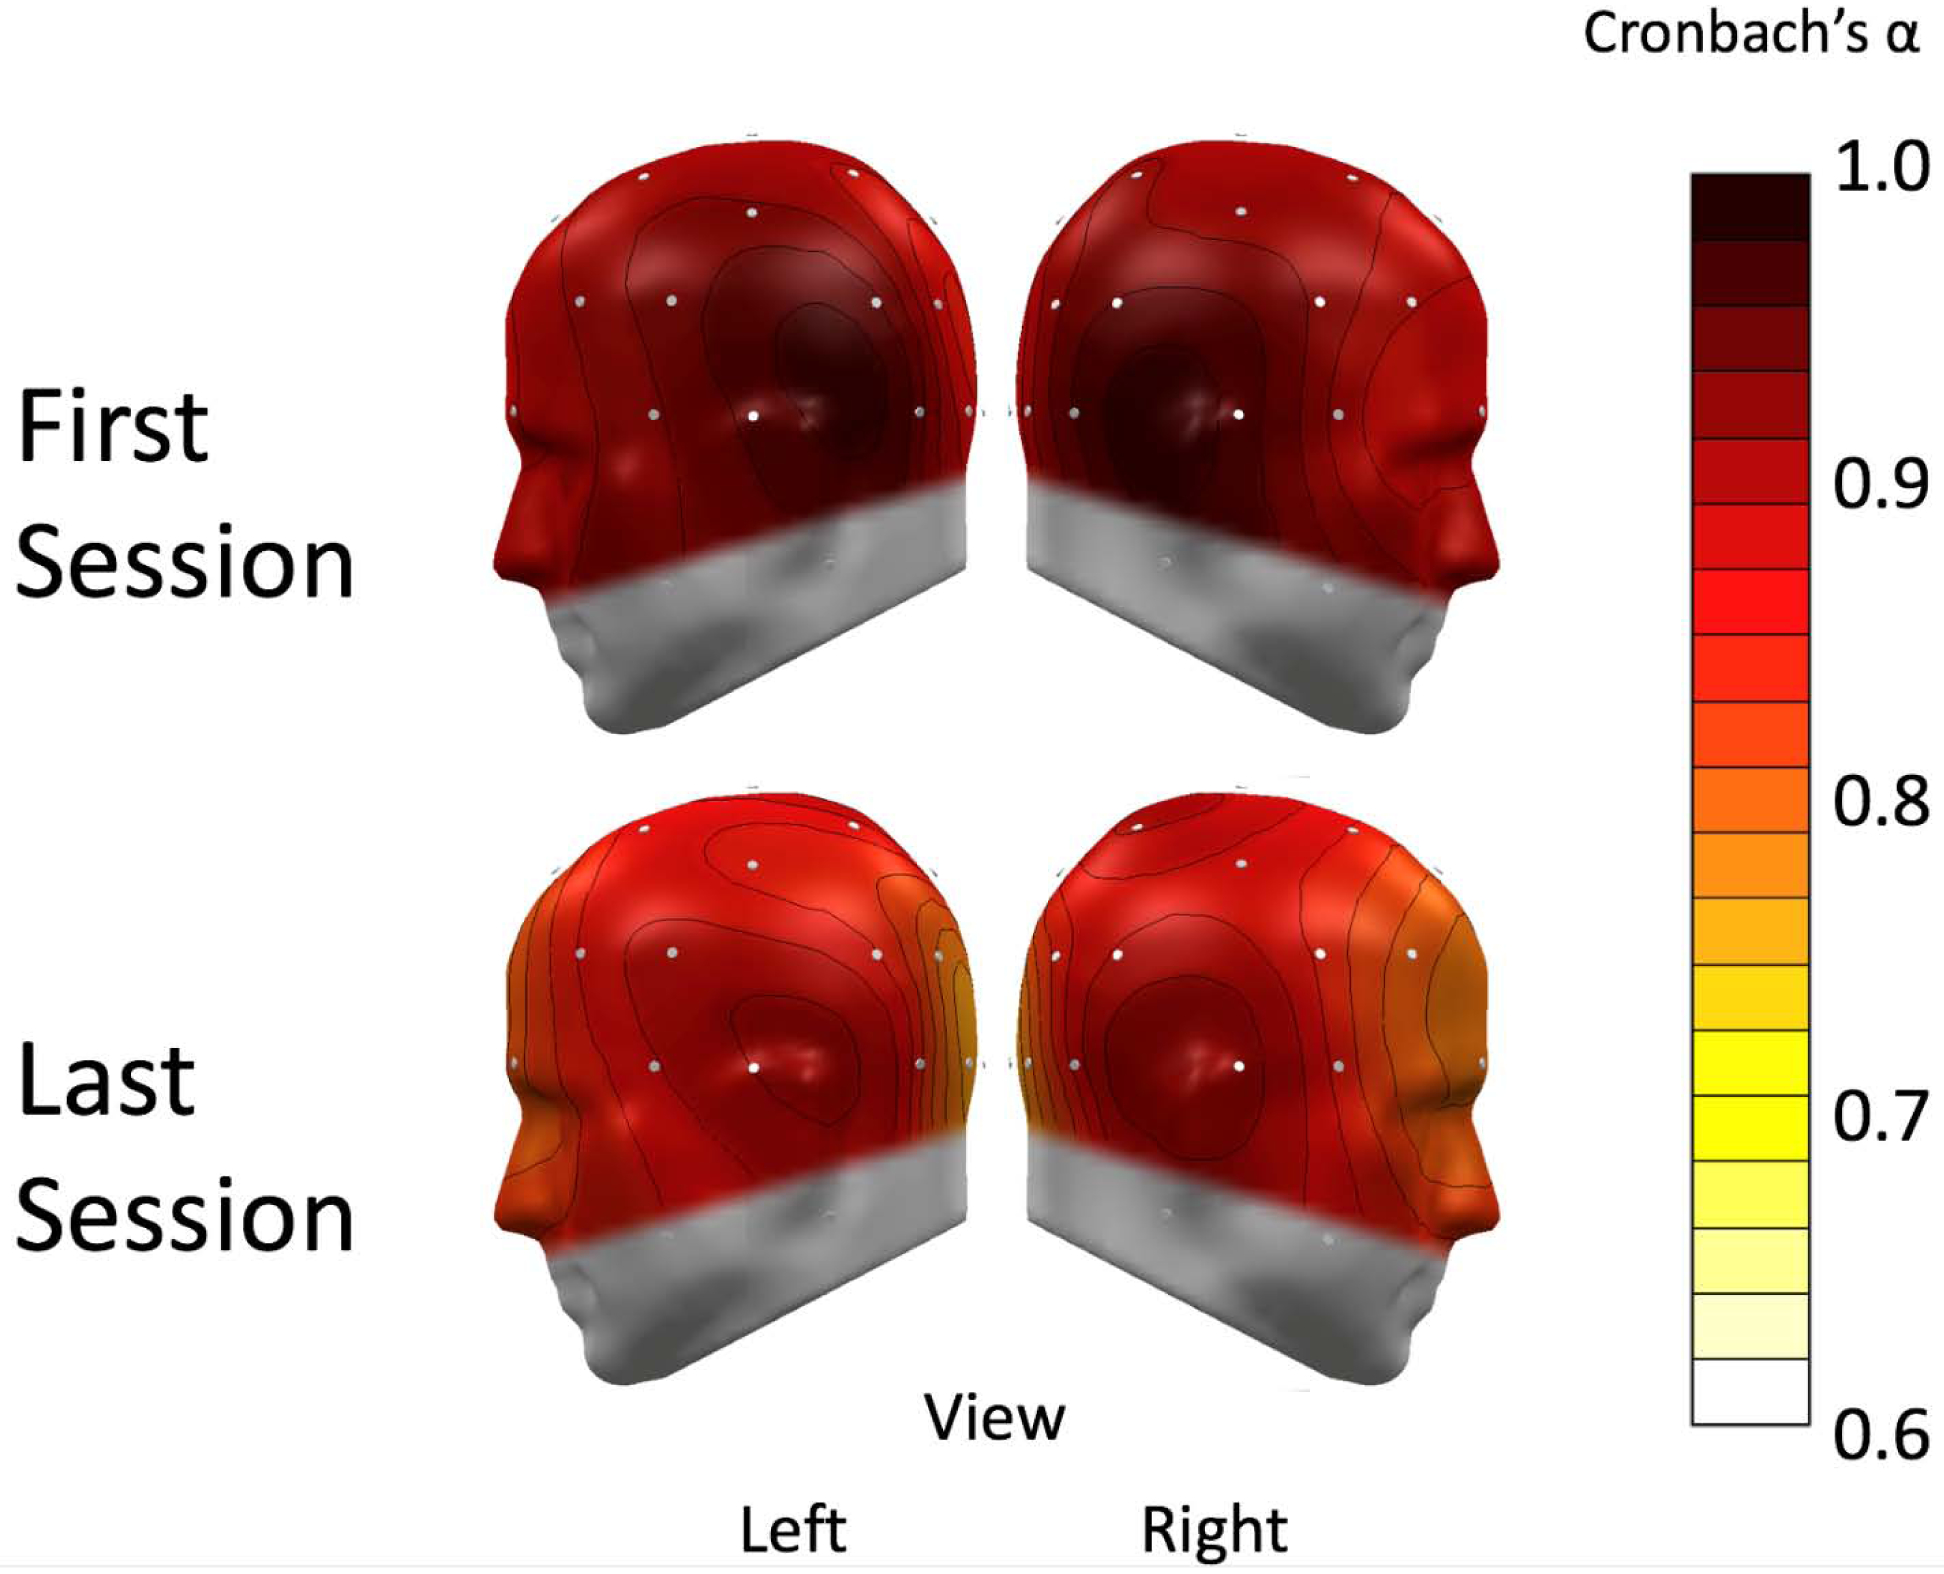
Figure 4:

A spline-interpolated topographical distribution of Cronbach’s αs of alpha-band power. The electroencephalography (EEG) sensors are represented as white dots on the scalp. The first session (top) and final session (bottom) internal consistency scores were high across all sensors (>0.7). Left and right hemispheres are both shown for clear viewing.
