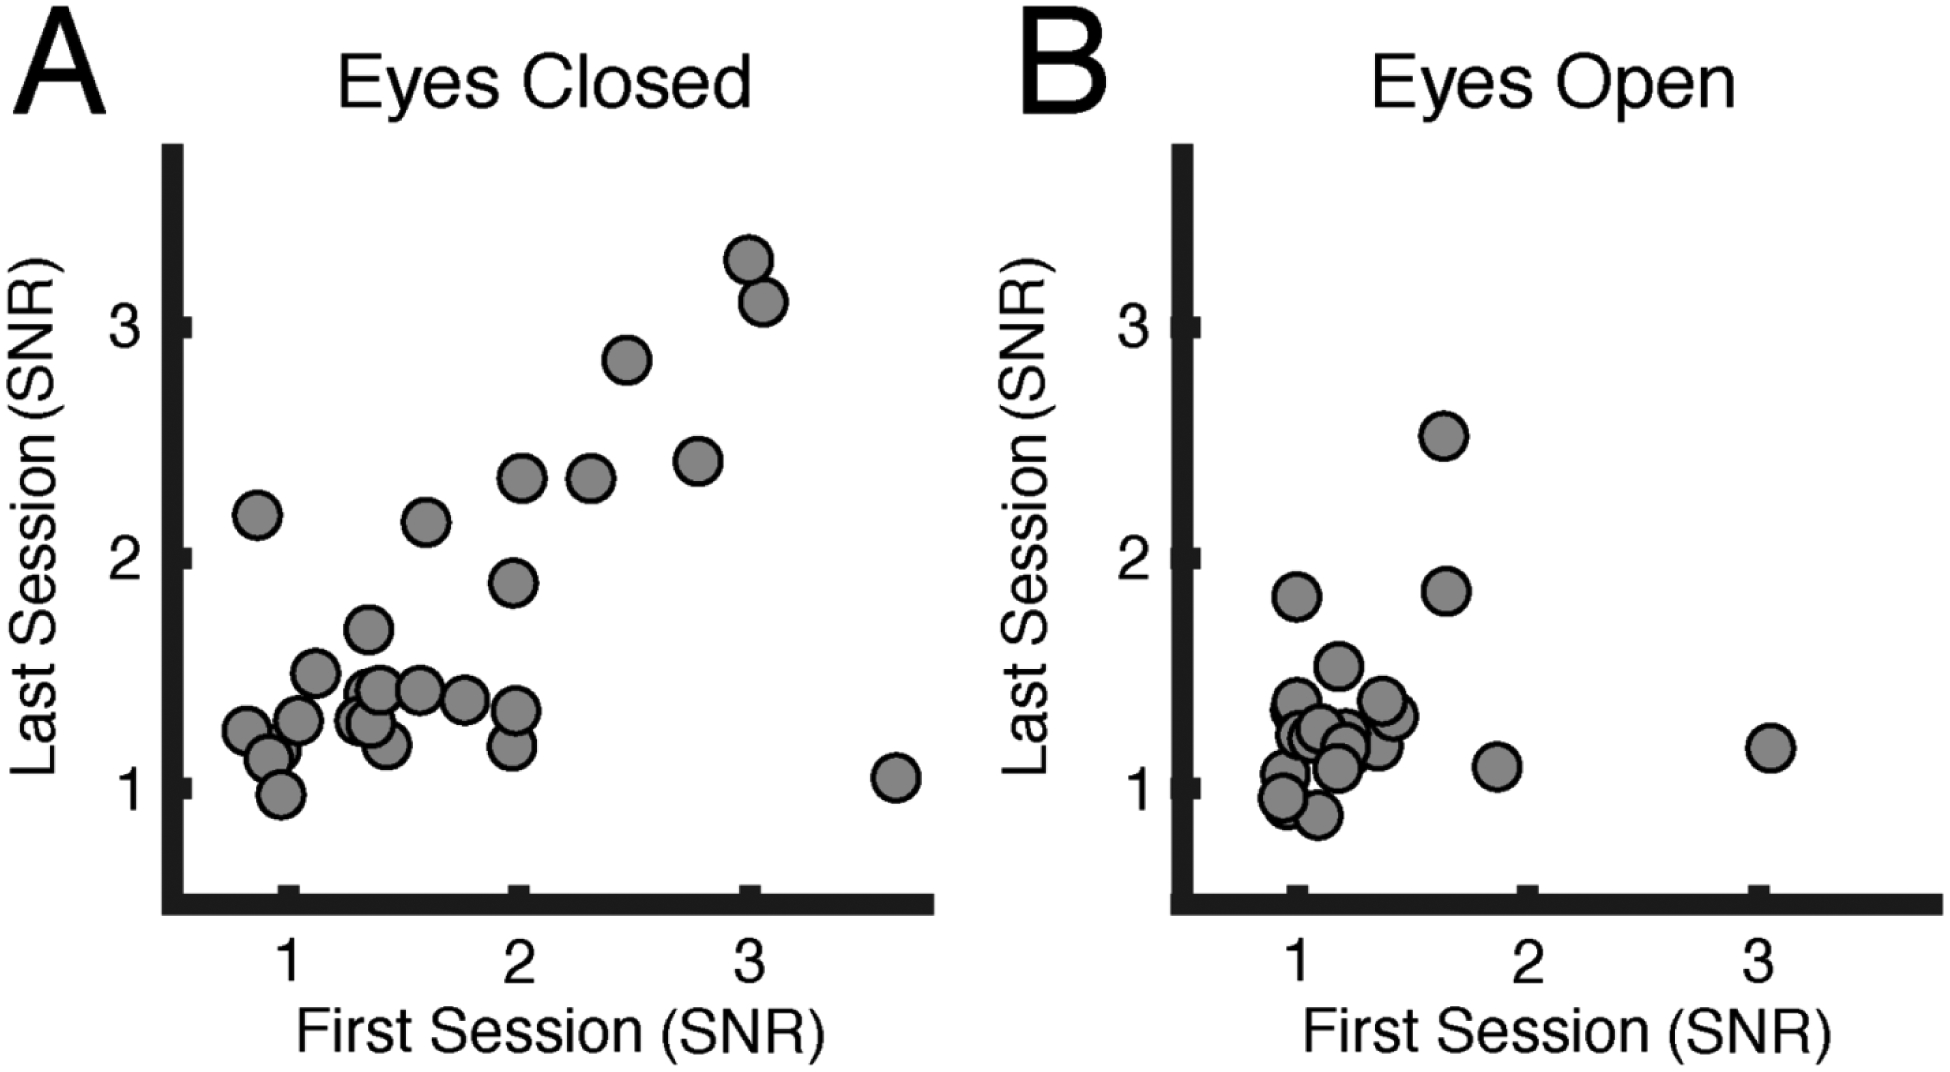
Figure 5:

Signal-to-noise ratios (SNRs) of baseline alpha power. These scatterplots show baseline participant alpha signal-to-noise ratios (averaged between sensors at Pz and Oz) for each of two EEG sessions, approximately one week apart. Each dot represents one participant, with the x-axis representing alpha power during the first session and the y-axis representing alpha power during the last session. A. The baseline eyes-closed condition (left) shows a pronounced cross-session stability compared to B. the baseline eyes-open condition (right).
