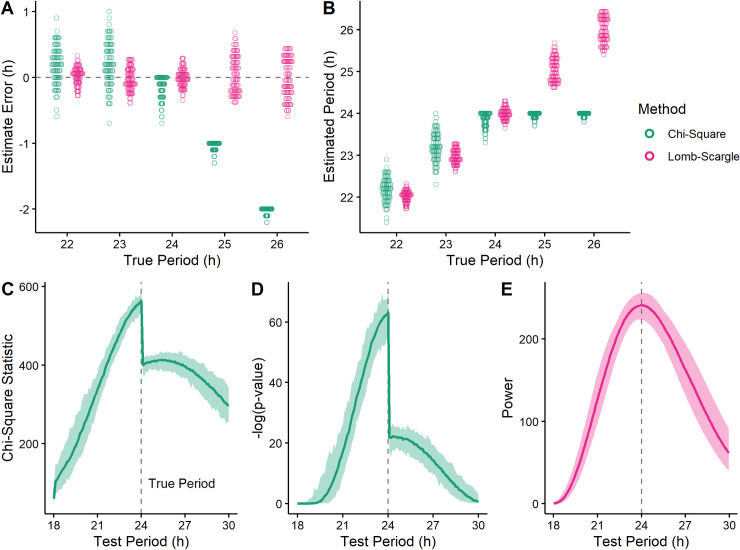
Fig 1. Period underestimation by the chi-square periodogram (CSP) coincides with a discontinuity in the periodogram.
(A) Period estimation error and (B) estimated period for the CSP and Lomb-Scargle periodogram (LSP) on simulated time-courses that had various values of true period. Each point represents a simulated time-course (100 for each true period). Each time-course had a length of 3 days and a sinusoidal rhythm with amplitude 2. The dotted line in (A) indicates an error of 0. From the simulated time-courses with true period 24, periodograms of the (C) chi-square statistic and (D) corresponding -log(p-value) for the CSP, and (E) rhythmic power for the LSP. Each darker curve represents the median, each lighter shaded region represents the range.

