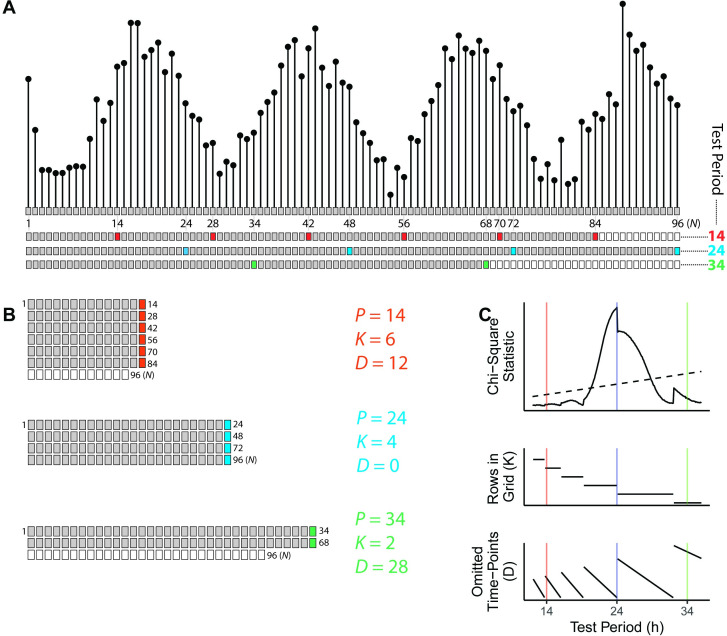
Fig 2. Schematic and example calculation of the chi-square periodogram.
(A) Top, a simulated time-course of length 96 h, having a sinusoidal rhythm with amplitude 4 and true period 24 h. Each dot and box represent a time-point, with 1 h between time-points. Bottom, sequential layout of time-points for three test periods, where every Pth time-point is colored according to the test period. Other time-points are grey if used in the calculation, and white if omitted. (B) Time-points organized into a grid for each test period, each with particular values of K and D. The variance of means from each complete row is used to calculate the chi-square statistic. (C) Periodogram of chi-square statistics and associated K and D values for the simulated time-course. The colored vertical lines represent the three test periods. The dashed line in the periodogram indicates the traditional alpha = 0.05 significance threshold.

