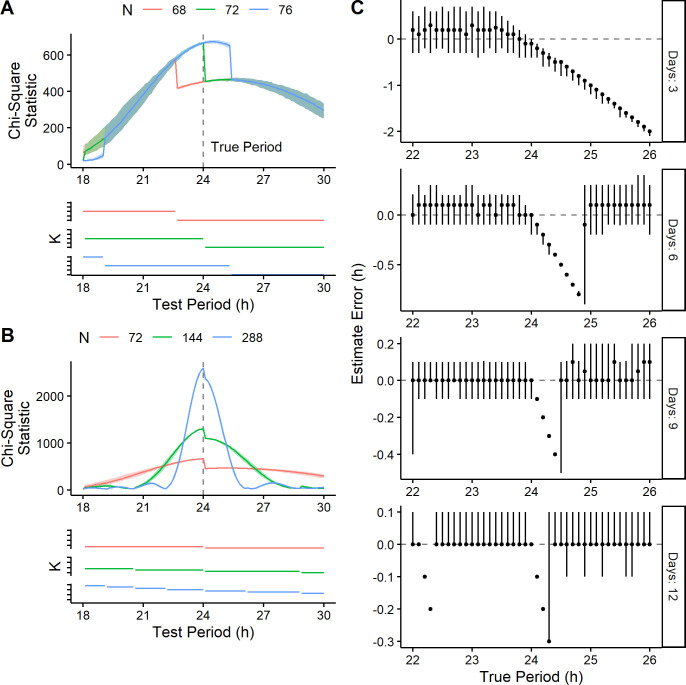
Fig 3. Time-course length influences the location of discontinuities in the CSP and the resulting period estimation bias.
Periodograms and the associated K values from simulated time-courses of length (A) 68, 72, and 76 h and (B) 72, 144, and 288 h (100 time-courses for each length). Each time-course had a sinusoidal rhythm with a true period of 24 h and an amplitude of 2. In the periodograms, each darker curve represents the median, each shaded region represents the range. (C) Period estimate error from simulated time-courses of various lengths and with various values of true period. Each point represents the median of 100 time-courses (all with a sinusoidal rhythm with amplitude 2), and each vertical line represents the 5th-95th percentile range.

