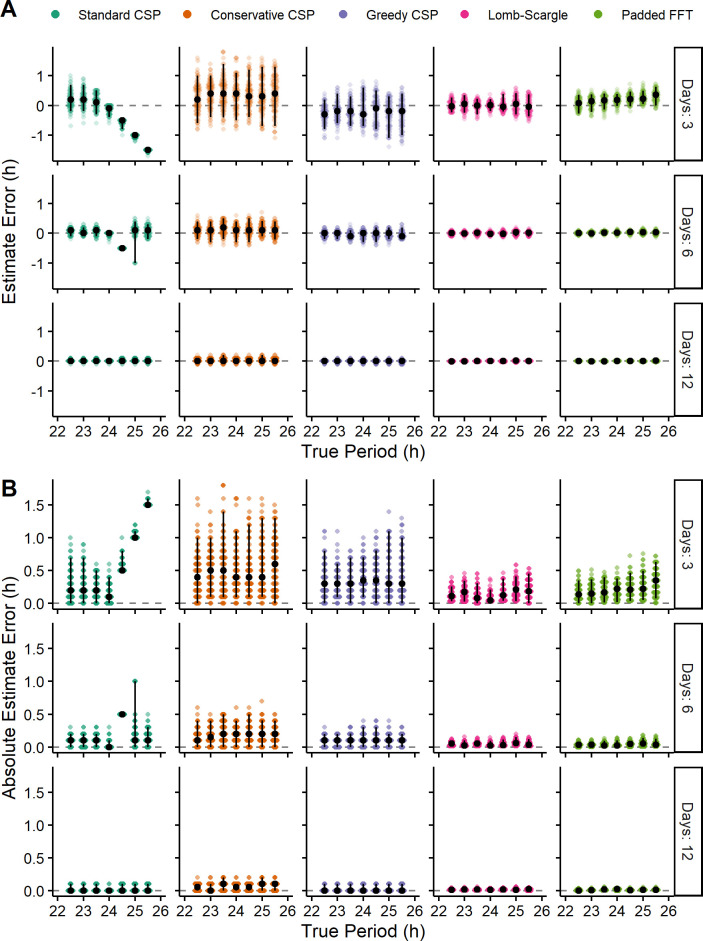
Fig 5. Revised versions of the CSP have reduced bias, but still tend to have lower accuracy than the LSP and padded FFT.
(A) Estimate error and (B) absolute estimate error for various methods on simulated time-courses of various lengths and with various values of true period. Each point represents a simulated time-course, with 100 time-courses per combination of length and true period. Each time-course had a sinusoidal rhythm with amplitude 2. Black circles and vertical black lines represent the median and 5th-95th percentile range, respectively.

