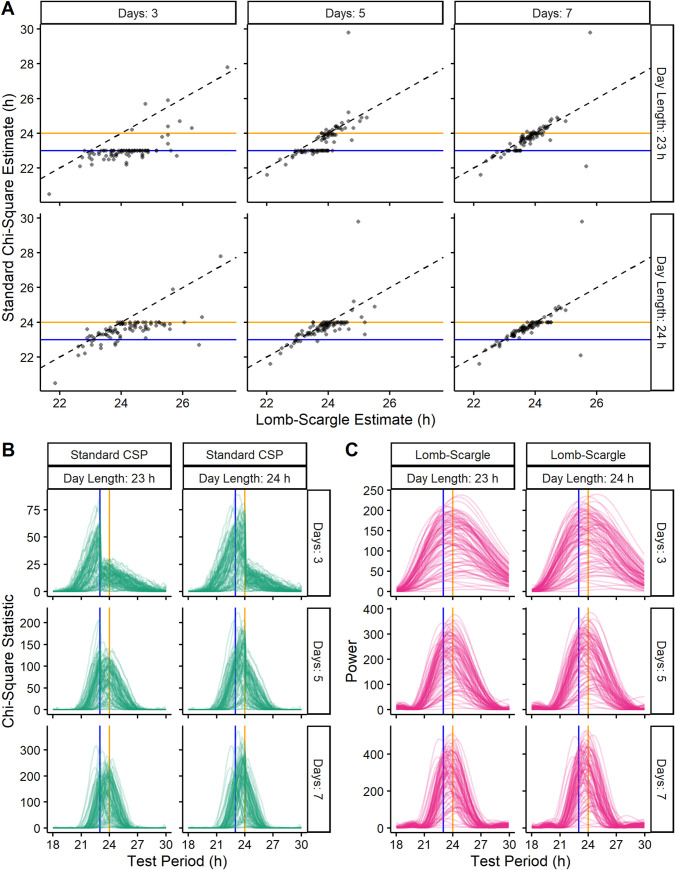
Fig 6. The bias and underlying discontinuity of the standard CSP are present in the analysis of experimental data.
(A) Scatterplots of estimated period for the LSP and standard CSP on time-courses of mouse wheel-running truncated to various lengths based on various numbers of days and day lengths. Periodograms for the (B) standard CSP and (C) LSP on the same truncated time-courses. Blue and orange lines indicate 23 and 24 h, respectively.

