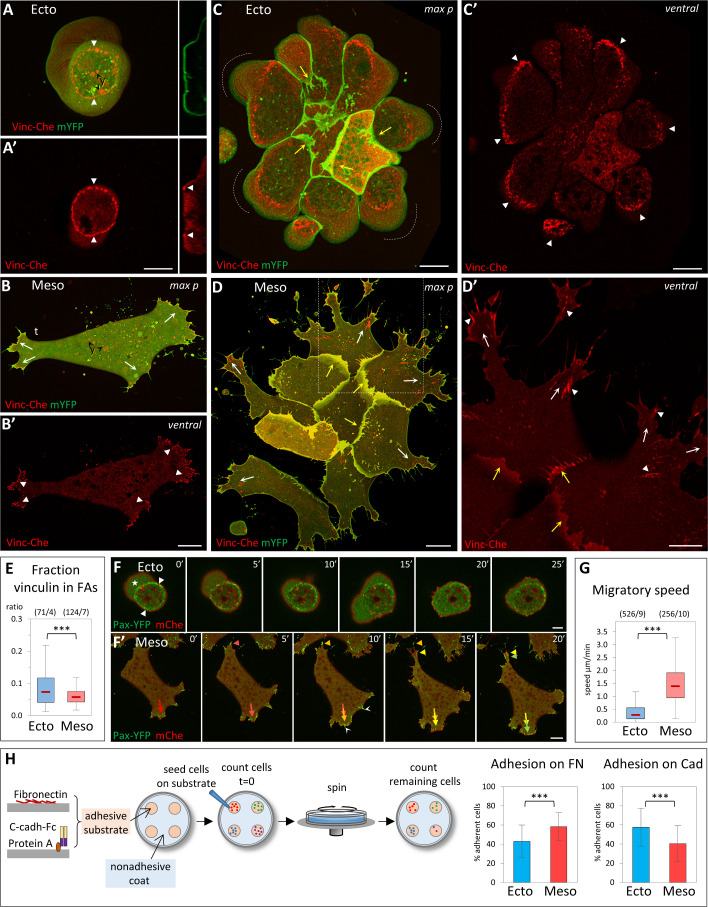
Fig 1. Distinct properties of ectoderm and mesoderm at the cellular level.
(A–E) Organization of cell-matrix adhesive structures. Dissociated Xenopus ectoderm (A, C) and mesoderm (B, D) cells expressing Vinc-Che and mYFP were plated on FN, either as single cells (A, B) or as small groups (C, D) and imaged live by spinning disc confocal microscopy. y: autofluorescence of yolk platelets. Ventral: ventral z plane close to the glass. max p: Maximal z projection. (A) Ectoderm cells do not spread on FN, but adhere to it through a characteristic adhesive ring (A, A’, filled arrowheads). They typically form blebs that are continuously pushed around the cell (dashed line with arrow). Right inserts: orthogonal view (orth) showing the cross-section of the membrane and of the vinculin ring (filled arrowheads). The dashed line underlines the bottom of the bleb. (B) Mesoderm cells spread on FN and extend multiple lamellipodia. They transiently polarize during their migration, with 1 protrusion becoming the tail (t); see also time lapse S1 Fig. They form vinculin-positive FAs (filled arrowheads), generally oriented in the direction of the protrusions (arrows). (C) Ectoderm cells form compact groups, with few protrusions in the center and numerous blebs at the periphery (dashed lines). External cells emit protrusions under the more central cells (yellow arrows). Individual cells build partial adhesive structures (filled arrowheads), which together form a supracellular ring. (D) Mesoderm cells form looser groups, each cell emitting multiple lamellipodia, most of them extending outwards (white and yellow arrows indicate peripheral and internal lamellipodia, respectively), with numerous FAs oriented radially (arrowheads). Panel D’ is an enlargement of the boxed portion of panel D. Scale bars: A, C, D 10μm; B 20μm; D’ 5μm. (E) Quantification of vinculin accumulation at FAs of isolated cells, expressed as Vinc-Che fluorescence concentrated in clusters divided by the total fluorescence along the ventral cortex. A color code is used throughout the figures, including blue for control ectoderm and red for control mesoderm. The box plots show the interquartile range (box limits), median (center line and corresponding value), and min and max values without outliers (whiskers). Statistical comparison using 2-sided Student t test. For all experiments presented in this study, P values are indicated as follows: *P < 0.05, **P < 0.01, ***P < 0.001; NS, not significant. The same color code is also used to indicate statistical comparison between 1 condition and control ectoderm (blue) or control mesoderm (red). Other comparisons are indicated by black asterisks and brackets. The numbers in parentheses correspond to the number of cells/ number of experiments. Refer to S1 Data. (F) Single-cell motility. Frames of spinning disc confocal time-lapse movies. Cells expressed paxillin fused to YFP (Pax-YFP) and membrane Cherry. (F) Ectoderm cells are immobile, anchored by their stationary adhesive ring (arrowheads) and bleb (star). Scale bars: F 5 μm; F’ 20 μm. (F’) Mesoderm cells actively migrate, rapidly remodeling protrusions and FAs (red-yellow-green color-coded arrows and arrowheads indicate successive positions respectively of 1 extending lamellipodium and the retracting tail). White arrowheads: FAs at thin protrusions. (G) Quantification of single-cell migration. Refer to S1 Data. (H) Adhesion assay. Dissociated cells were plated on the adherent substrate, either FN or recombinant cadherin-Fc fusion protein, then subjected to rotation. Adhesion is expressed as the percentage of cells remaining adherent after rotation (see Materials and methods). The column plots show averages and standard deviation of 15 experiments, a total of approximately 5,000 cells/conditions. Statistical comparison on the % adherent cells/experiment, pairwise 2-sided Student t test. Refer to S1 Data. FA, focal adhesion; FN, fibronectin; mYFP, membrane-targeted yellow fluorescent protein; Vinc-Che, Vinculin-Cherry; YFP, yellow fluorescent protein.

