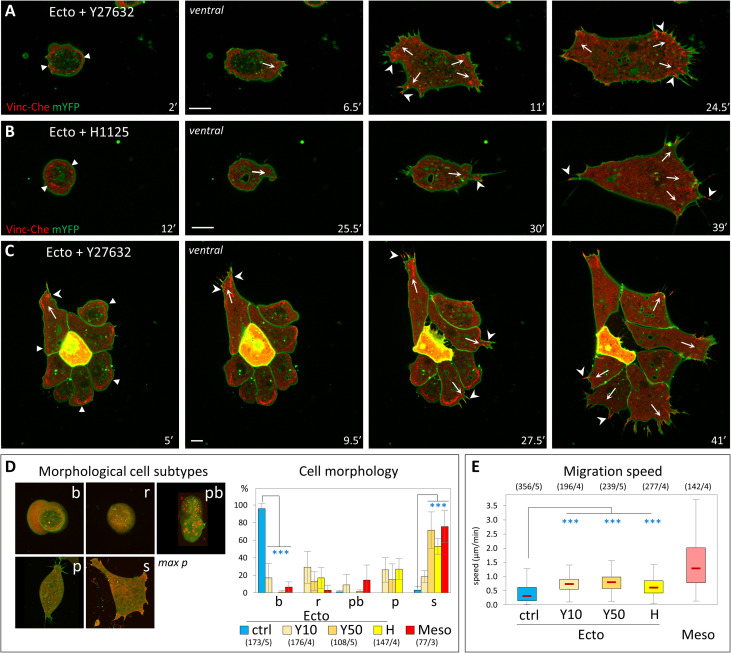
Fig 2. Inhibition of Rock confers ectoderm cells with mesoderm-like properties.
(A-C) Induction of cell spreading and migration by Rock inhibition. (A–D) Confocal imaging of initiation of spreading and migration for single cells (A, B) and a small group of cells (C). Rock inhibitors, Y27632 (50 μM), and H1125 (1 μM) were added at time = 0’. Note that the onset of the transition is not synchronous. Arrows: nascent protrusions; filled arrowheads: ring-like adhesion; arrowheads: FAs. Scale bars: 10 μm. (D) Shift in cell morphology. Cells were classified in morphological subtypes: round and blebbing (b), round without blebs (r), polarized (p), and spread (s). In wild-type conditions, round cells are typically immotile, while polarized and spread cells migrate. A fifth category, named polarized with bleb (pb), includes cells with irregular morphology and blebs. The diagram shows the distribution of wild-type mesoderm and ectoderm cells, as well as of ectoderm cells treated for 50 minutes with 10 μM or 50 μM Y27632 (Y10 and Y50) or 1μM H1125 (H). For b and s categories, conditions were compared to control ectoderm by 1-way ANOVA followed by Tukey HSD post hoc test. Refer to S1 Data. (E) Migration speed of Rock-inhibited cells. Quantification as in Fig 1. Comparison to ectoderm control by 1-way ANOVA followed by Tukey HSD post hoc test. Refer to S1 Data. ANOVA, analysis of variance; FA, focal adhesion; HSD, honestly significant difference; mYFP, membrane-targeted YFP; Vinc-Che, Vinculin-Cherry.

