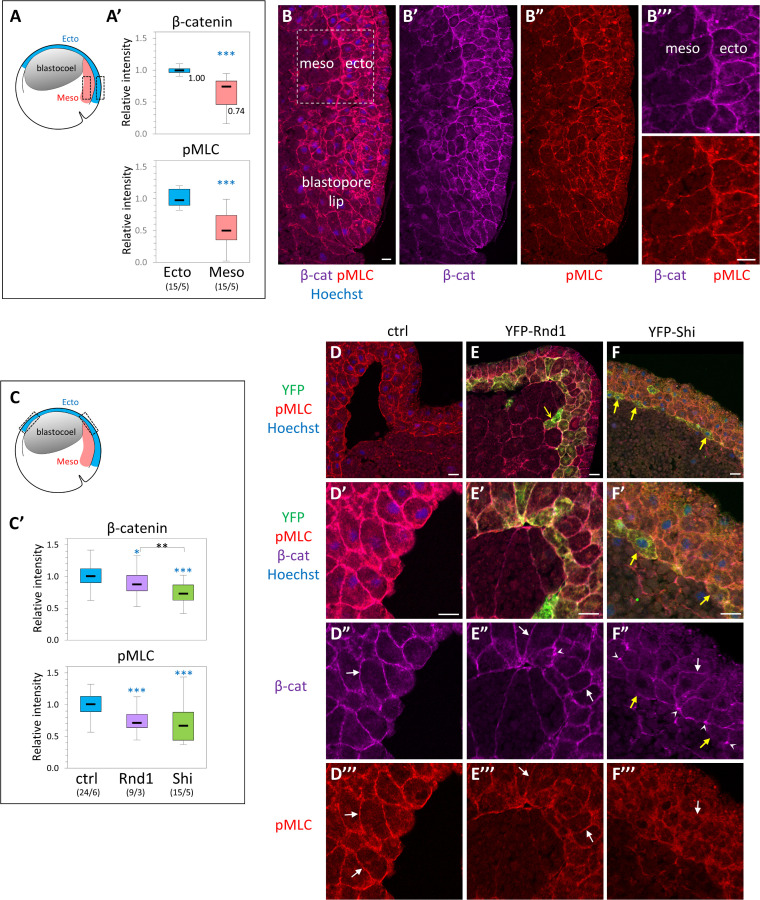
Fig 6. Effect of ectopic expression of Rnd1 and Shirin on cell adhesive structures and cortical myosin.
β-catenin, used as general marker for cadherin-based cell adhesions, and pMLC were localized by immunofluorescence on cryosections of whole embryos at early gastrula stage. The fluorescence along the cell periphery, defined by the β-catenin signal, was quantified and expressed relative to the median intensity of control ectoderm. (A, B) Comparison of β-catenin and pMLC levels in the dorsal ectoderm and dorsal PCM of normal embryos. (A) Diagram of the embryo with boxes indicating the regions used for quantification. (A’) Quantification. Numbers into brackets: number of embryos/number of experiments. Statistical comparison to ectoderm using 2-sided Student t test. (B) Example of dorsal region, immunolabeled for β-catenin (magenta) and pMLC (red). Nuclei were counterstained with Hoechst. (B”’) Enlarged view of the region used for quantification. (C–G) Effect of Rnd1 and Shirin ectopic expression in the ectoderm. (C) Diagram indicating the regions of the ectoderm used for quantification. For consistency, all analyses were performed on the upper lateral region (both dorsal and ventral, indicated by dashed boxes in the diagram, because it constitutes a robust landmark where the inner ectoderm layer has a stereotyped organization. (C’) Quantification. Statistical comparison using 2-sided, pairwise Student t test. Refer to S1 Data. (D-G) Examples of control (D), YFP-Rnd1-expressing (E), and YFP-Shirin-expressing (F) ectoderm, immunolabeled for the YFP-tag (green), β-catenin (far red, colored in magenta), and pMLC (red). Top panels present general views, and the other panels show enlarged portions of the inner ectoderm layer used for quantification. Note that the strong bending of the ectoderm layer is due to the partial collapse of the blastocoel cavity during fixation. White arrows point to plasma membranes marked by β-catenin (D’, E’, F’) and to the corresponding pMLC signal (D”, E”, F”). Little to no pMLC enrichment is observed in Shirin-expressing cells (F”). Arrowheads in E’ and F’ point to concentrations of β-catenin, particularly frequent in Shirin-expressing ectoderm, and which contrast with the low membrane signal (arrow). Yellow arrow in E: Rnd1-expressing ectoderm cells that have penetrated into the mesoderm layer. Yellow arrows in F: ectoderm cells expressing particularly high levels of YFP-Shirin. PCM, prechordal mesoderm; pMLC, phosphorylated MLC.

