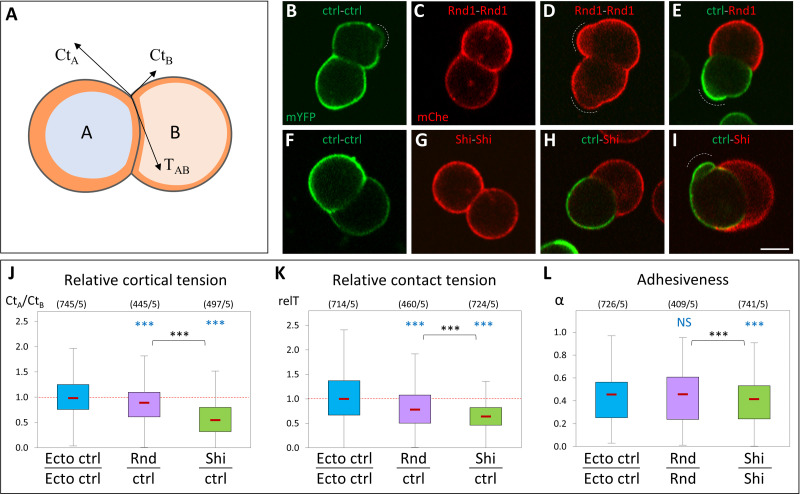
Fig 8. Ectopic expression of Rnd1 or Shirin modulates ectoderm cortical tension and adhesiveness.
(A) Diagram of an asymmetrical cell doublet, representing the balance between cortical tensions at free edges CtA, CtB, and contact tension TAB. The orange layer symbolizes the actomyosin cortex. The curved cell–cell interface reflects unequal CtA and CtB tensions. (B–I) Examples of homotypic and heterotypic doublets, imaged by live confocal microscopy. Doublets were made by combining dissociated control ectoderm cells expressing mYFP (ctrl) and either Rnd1 or Shirin-expressing cells markerd with mCherry. Wild-type and Rnd1-expressing cells often displayed blebs (dashed lines). Curved interfaces indicative of tensile differences were observed for all combinations, including for homotypic doublets (e.g., panel F), but were most systematically found for heterotypic ctrl-Shirin doublets (H, I). Scale bar: 20 μm. (J–L) Relative tension measurements based on the geometry at cell vertices (see S1 Appendix). (J) Relative cortical tension between Rnd1 or Shirin-expressing cells and control ectoderm cells calculated from the ratio CtA/CtB of heterotypic doublets. The ratio for control homotypic doublets is provided for comparison. See S1 Appendix for complete measurements. Vertices flanked by a bleb (D and I) were omitted from calculations. (K) Relative strength of contact tension TAB at homotypic contacts, compared to control ectoderm-ectoderm T, the median of which was set arbitrarily at 1. See S1 Appendix for more details. (L) Relative adhesiveness α, calculated for homotypic doublets. Numbers in brackets: vertices/experiments. Statistical comparison using 1-way ANOVA followed by Tukey HSD post hoc test. Refer to S1 Data. ANOVA, analysis of variance; HSD, honestly significant difference.

