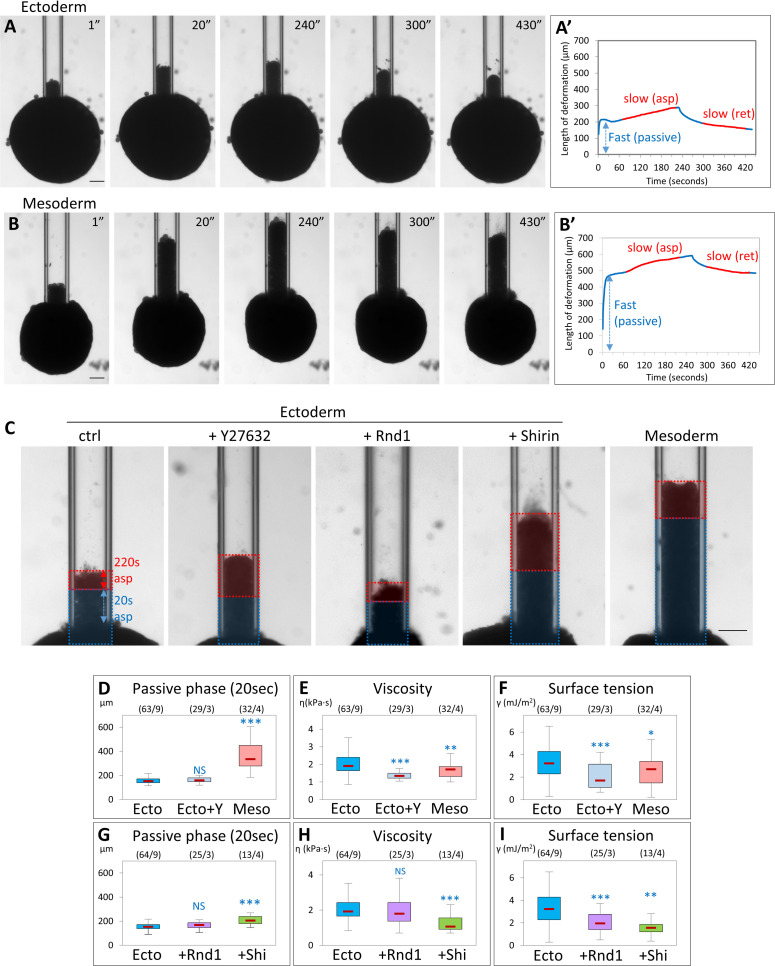
Fig 10. ROCK inhibition and Rho regulators modulate tissue stiffness, viscosity, and surface tension.
Micropipette aspiration was used to measure physical properties of tissue explants. Explants were aspirated into the pipette at constant pressure, then pressure was reset to 0 to let the explant retract. (A, B) Examples of aspiration and retraction of control ectoderm and mesoderm explants. Aspiration pressure was 250 Pa. Pressure was released after 240 seconds. Scale bars: 100 μm. (A’, B’) Corresponding aspiration and release profiles. The blue double arrows indicate the extent of deformation of the tissue during the first 20 seconds, defined as the fast “passive” phase. The two slow, linear phases of aspiration and release, highlighted in red, were used to calculate viscosity and TST. Scale bars: 100 μm. (C) Examples of aspiration of control ectoderm, ectoderm treated with Y27632, or expressing Rnd1 or Shirin, and control mesoderm. Pressure was 250 Pa. Images display the frame corresponding to the deformation 220 seconds after the initiation of aspiration. The colored overlays indicate the distances of deformation during the first fast phase (20 seconds, blue) and during the subsequent slow phase (220 seconds, red). Scale bar: 100 μm. (D–I) Calculated parameters: (D, G) Length of deformation 20 seconds after initiation of aspiration, encompassing the initial passive phase. (E, H) Tissue viscosity calculated from the rates of aspiration and retraction (see Materials and methods). (F, I) TST. Numbers in brackets are number of explants and number of experiments. Statistical comparisons: 1-way ANOVA followed by Tukey HSD post hoc test. Refer to S1 Data. ANOVA, analysis of variance; HSD, honestly significant difference; Rock, Rho-kinases; TST, tissue surface tension.

