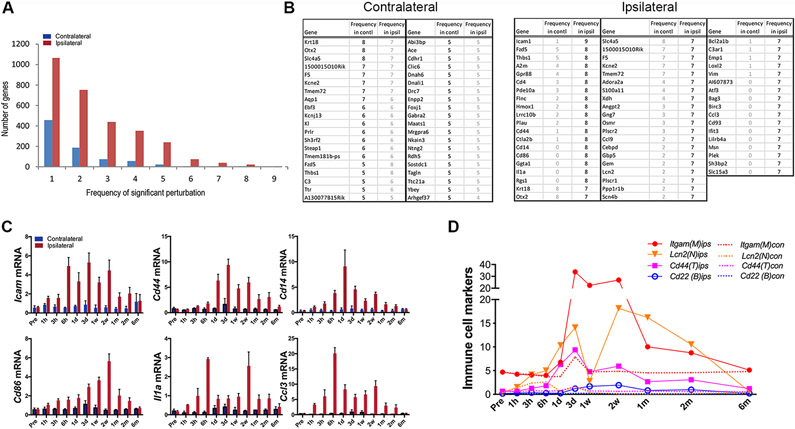
Figure 2.
Perturbation frequency and frequently perturbed gene profiles. A, Frequency of perturbed genes across post-stroke time points. B, List of the most frequently perturbed genes in the both hemispheres. The frequency of perturbation of the same gene on the other hemipshere was indicated in gray. C, Temporal profiles of genes that were perturbed ≥7 times in the post-ischemic brain. D, Temporal gene expression profiles of representative immune cell markers, Itgam, microglia/macrophages; Lcn2, neutrophils; Cd44, T cells; Cd22, B cells.

