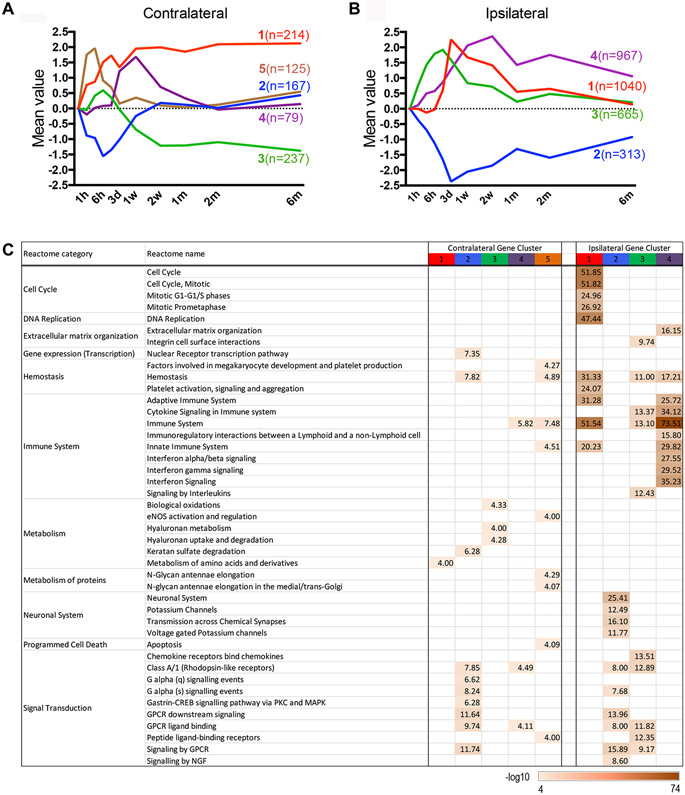
Figure 4.
Clustering and pathway analysis of genes perturbed in the post-stroke brain. A,B, Five gene clusters in the contralateral (A) and 4 in the ipsilateral hemisphere (B) were identified. Average expression of each cluster is color coded with content in parenthesis indicating the number of genes in each cluster. C, MSigDB reactome enrichment analysis. The values of each gene across all time points were log2 transformed and normalized as described in Method section.

