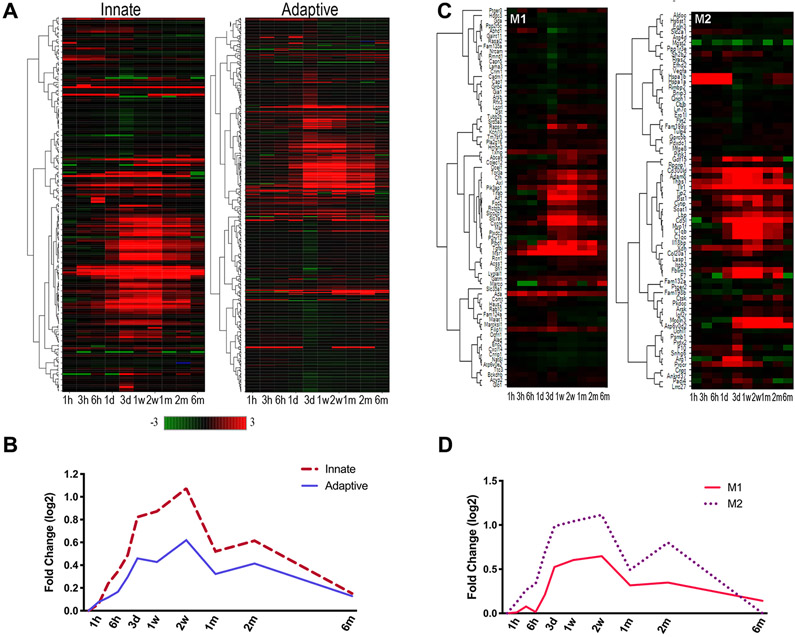
Figure 5.
Expression of key immune genes in the ipsilateral hemisphere. Heat map and average expression of of innate or adaptive genes (A, B) and M1 and M2 genes (C,D) in the post-stroke brain. Green (decreased) and red (increased) intensities indicate log2 transformed-fold change compared to pre-stroke.

