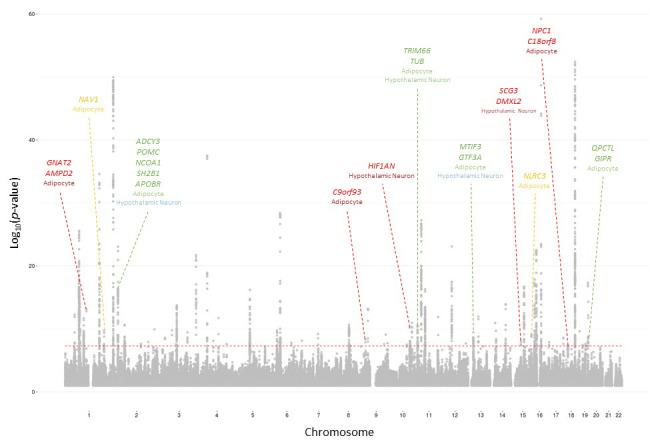
Figure 1. 2015 BMI Manhattan plot depicting loci identified with 2010 salvaged SNPs 2015 BMI loci identifiable with 2010 salvaged SNPs.

Cell type where locus was identified indicated below locus name. Color indicates the p-value threshold where the locus became implicated (Locke et al., 2015). Color key: Green – 5×10⁻⁸≤p<5×10⁻⁷, blue – 5×10⁻⁷≤p<5×10⁻⁶, orange – 5×10⁻⁶≤p<5×10⁻⁵, red – 5×10⁻⁵≤p<5×10⁻⁴.
