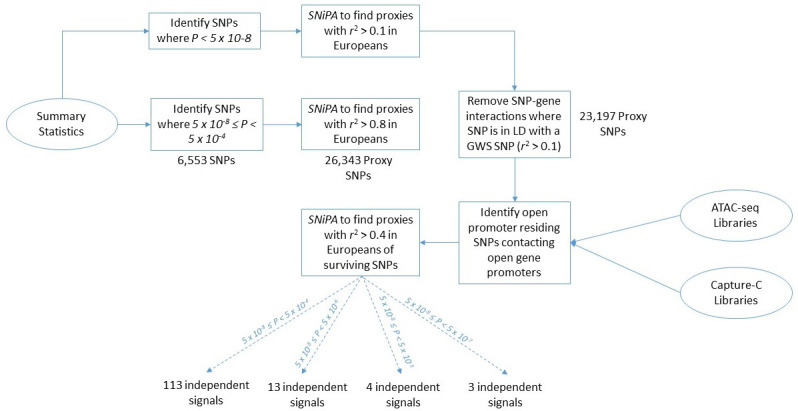
Figure 3. Flowchart of the pipeline describing each computational step.

BMI 2010–2015 data is utilized here as an example to report the number of SNPs and loci that occur at each step of the analysis.

BMI 2010–2015 data is utilized here as an example to report the number of SNPs and loci that occur at each step of the analysis.