. 2021 Jan 4;10:e63177. doi: 10.7554/eLife.63177

Figure 1. Enrichment of West African ancestry at the DARC locus in Santiago, Cabo Verde.

(A) Map of Cabo Verde islands and sample sizes for number of individuals from each island region. (B) The distribution of West African-related local ancestry proportion across the genome by SNP (n = 881,279) by island, with the DARC locus marked by vertical red lines. Local ancestry was estimated using RFMix (see Materials and methods). The DARC locus is an outlier for high West African-related ancestry in Santiago, but not Fogo or the Northwest Cluster.

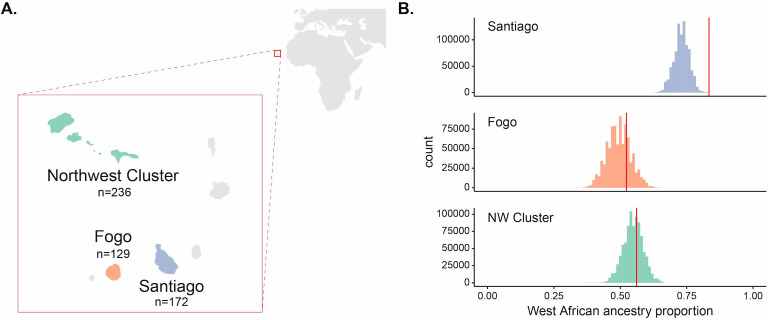
Figure 1.

Figure 1—figure supplement 1. Local ancestry proportion along the genome in Santiago.

Figure 1—figure supplement 1.

The mean is indicated by the solid horizontal line, and dashed horizontal lines represent three standard deviations from the mean. Again, this plot demonstrates Duffy-null (red dot) as the highest value for West African ancestry proportion.

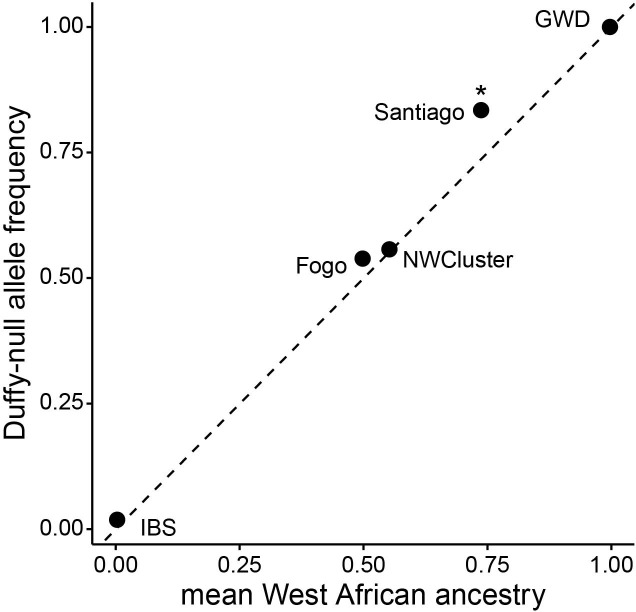
Figure 1—figure supplement 2. The observed frequency of Duffy-null for each island vs neutral expectation based on mean global ancestry (as estimated by admixture).

Figure 1—figure supplement 2.

*indicates significant p-value <0.001 for binomial test (see Table 1 for sample sizes and further details).