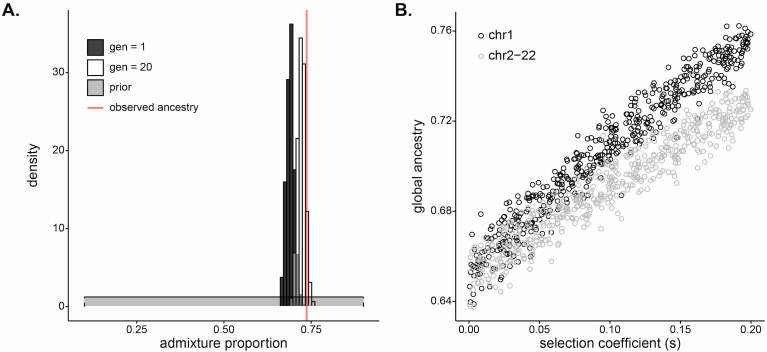
Figure 5. Selection at a single locus impacts genome-wide ancestry proportion.
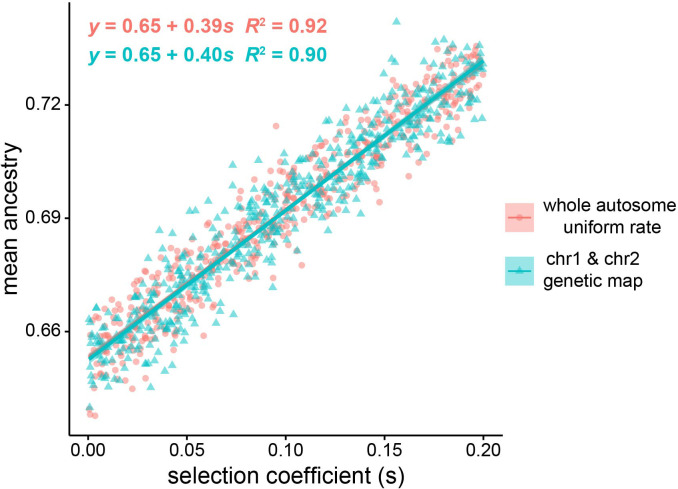
(A) Inferred (dark gray), simulated (white), and observed (red) mean of global ancestry in Santiago over time. The dark gray histogram plots the posterior distribution for initial West African ancestry contribution inferred using approximate Bayesian computation (ABC) (median, 0.690); the prior distribution [] is in light gray. The red line plots the mean global ancestry estimated by admixture from modern genetic data from Santiago, 0.737. The observed global ancestry is higher than most values of the initial contributions inferred in dark gray. The white histogram plots the distribution of West African global ancestry proportion calculated after 20 generations in populations simulated with selection coefficients and initial ancestries drawn from the ABC-inferred values (median, 0.723). The global ancestry calculated after 20 generations of simulated selection (white) more closely matches that observed from Santiago genetic data (red line). (B) West African mean global ancestry proportion calculated for 500 simulated populations after 20 generations under varying single-locus selection coefficients, . We simulated whole autosomes, setting the initial West African ancestry contribution to 0.65. Black circles indicate mean ancestry on chromosome 1 alone. Gray circles indicate mean ancestry on the other autosomes (2–22). The increase in ancestry with selection for gray circles demonstrates that selection impacts global ancestry beyond the local effects of the chromosome under selection.


