. 2021 Jan 6;10:e63726. doi: 10.7554/eLife.63726

Figure 9. Yorkie regulates sarcomere protein expression.

(A, B) Mhc-GFP (A) and Act88F-GFP (B) proteins levels visualised with a GFP nanobody together with actin comparing wild-type control with yorkie-IR and yorkie-CA at 24 hr and 32 hr after puparium formation (APF). Scale bars represent 2 µm. GFP channel is displayed using the ‘fire’ look-up table. (C) Quantification of relative GFP protein levels compared to wild type (wild-type mean set to one for each individual experiment). Bar plots display average normalised value and each dot represents one hemithorax. Student’s t test, *** p-value<0.001, ** p-value<0.01 * p-value<0.05.

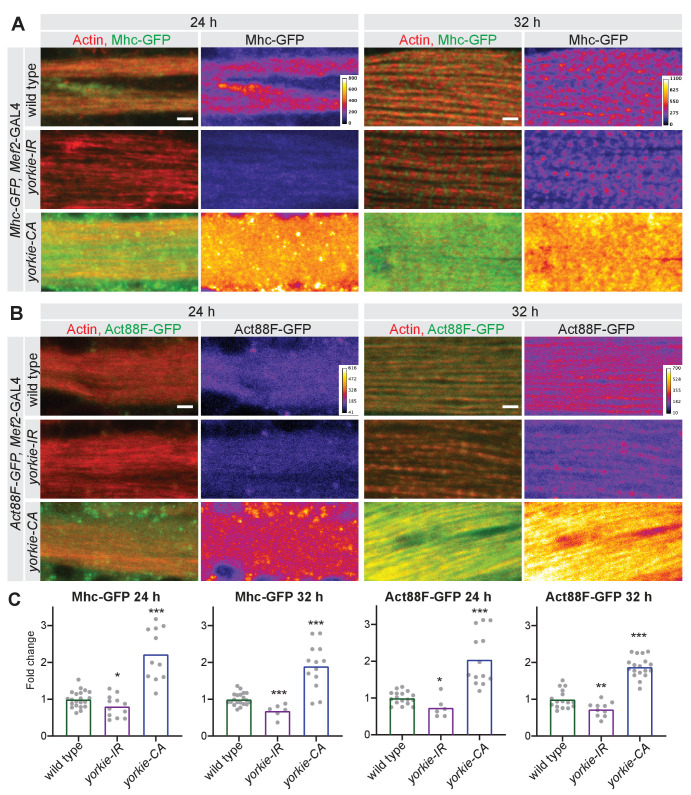
Figure 9.

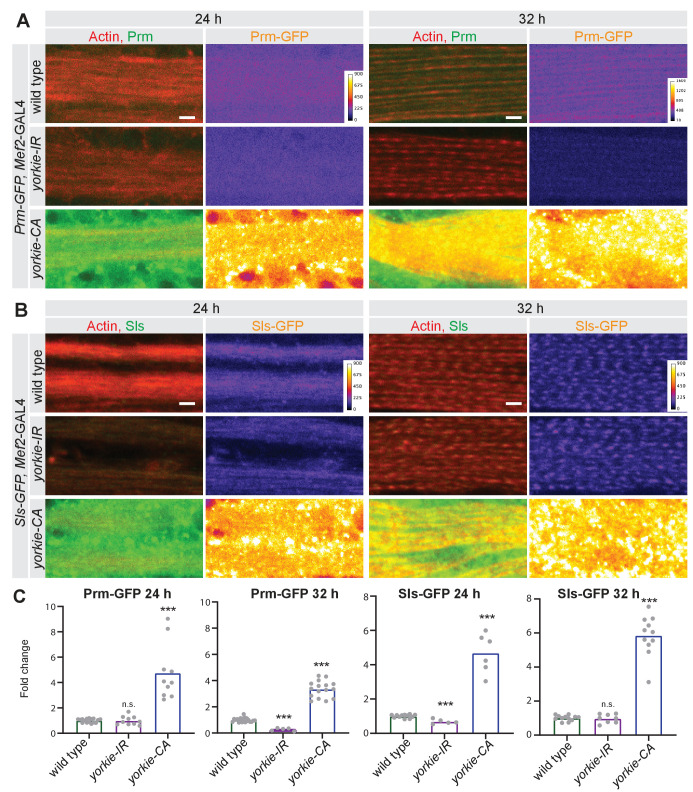
Figure 9—figure supplement 1. Yorkie regulates sarcomere protein expression.

Figure 9—figure supplement 1.

(A, B) Prm-GFP (A) and Sls-GFP (B) proteins levels visualised with a GFP nanobody together with actin comparing wild type control with yorkie-IR and yorkie-CA at 24 hr and 32 hr after puparium formation (APF). Scale bars represent 2 µm. GFP channel is displayed using the ‘fire’ look-up table. (C) Quantification of relative GFP protein levels compared to wild type (wild type mean set to one for each individual experiment). Bar plots display average normalised value and each dot represents one hemithorax. Student’s t test, *** p-value<0.001.