. 2021 Jan 19;10:e63910. doi: 10.7554/eLife.63910

Figure 2. Fitness changes during evolution.

Competitive fitness is plotted relative to a reference strain in each environment. Inferred ancestral fitness is indicated by horizontal lines and colored by strain. Populations with premature stop-codon reversion mutations in ADE2 are indicated by asterisks. Correlations between replicate fitness measurements are shown in Figure 2—figure supplement 2.

Figure 2.

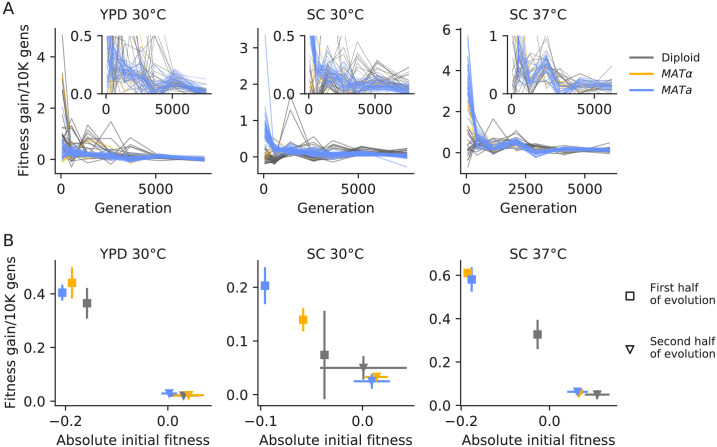
Figure 2—figure supplement 1. Declining adaptability.

Figure 2—figure supplement 1.

(A) Fitness increase rate (per 10,000 generations) between timepoints over the course of evolution. The insets are the same data, but with a cut-off y-axis. (B) For each strain and environment, the mean rate of fitness gain over the first half of evolution (square points) and the second half of evolution (triangle points), as a function of initial fitness or the mean fitness at the midpoint, respectively. Colors are the same as in (A). Error bars represent standard deviations.
Figure 2—figure supplement 2. Correlations between absolute fitness measured in replicate competitions with a fluorescent reference.

Figure 2—figure supplement 2.