. 2021 Jan 19;10:e63910. doi: 10.7554/eLife.63910

Figure 3. Dynamics of molecular evolution.

(A) Allele frequencies over time in four example populations. Nonsynonymous mutations in ‘multi-hit’ genes are solid black lines (see ‘Parallelism’ section below), nonsynonymous mutations in the adenine biosynthesis pathway are colored orange and labeled, other nonsynonymous mutations are thin gray lines, and synonymous mutations are dotted lines. (B) Number of fixed mutations over time in each population. Timepoints with average coverage less than 10 (for haploids) or 20 (for diploids) are not plotted.

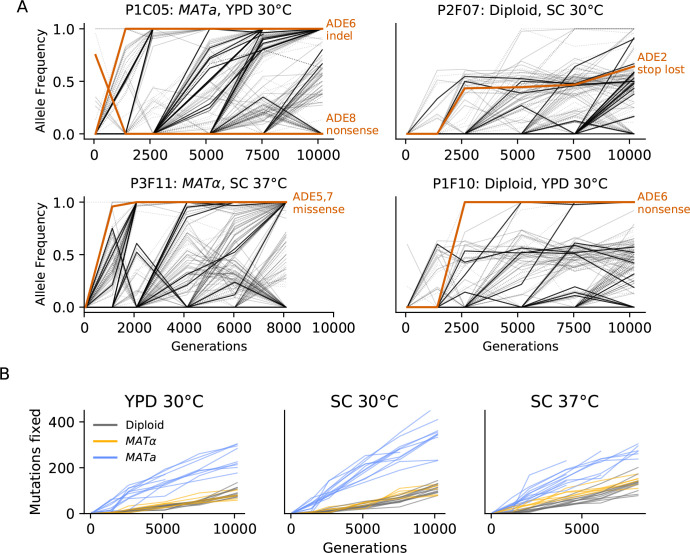
Figure 3.

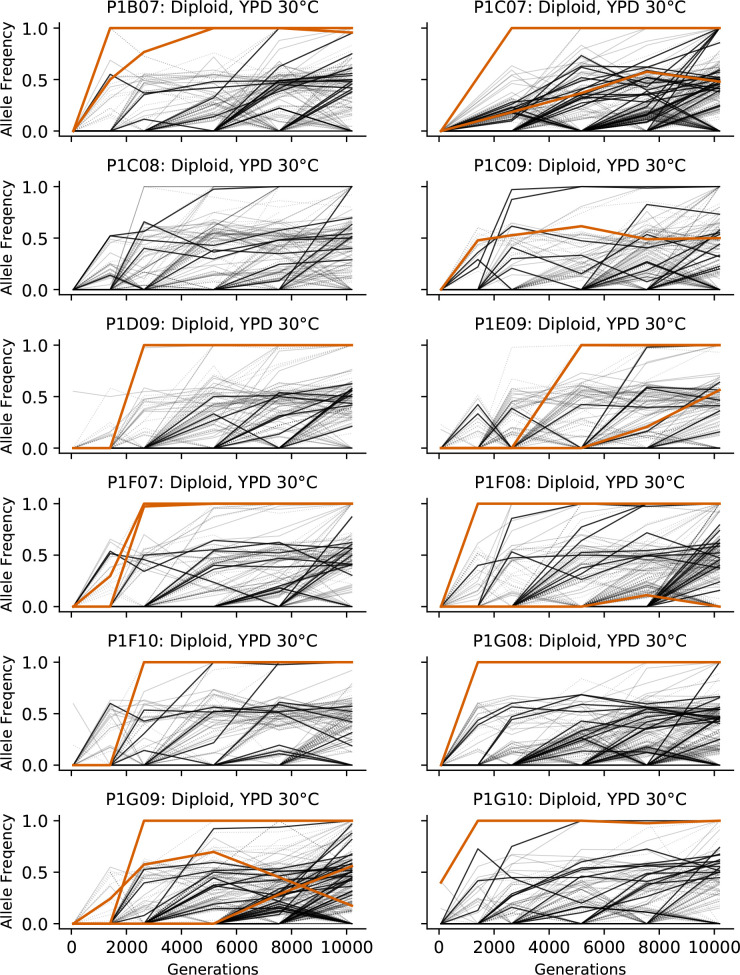
Figure 3—figure supplement 1. Allele frequencies over time in all focal diploid populations in YPD 30°C.

Figure 3—figure supplement 1.

Nonsynonymous mutations in ‘multi-hit’ genes are solid black lines, mutations in the adenine biosynthesis pathway are colored orange, other nonsynonymous mutations are thin gray lines, and synonymous mutations are dotted lines.
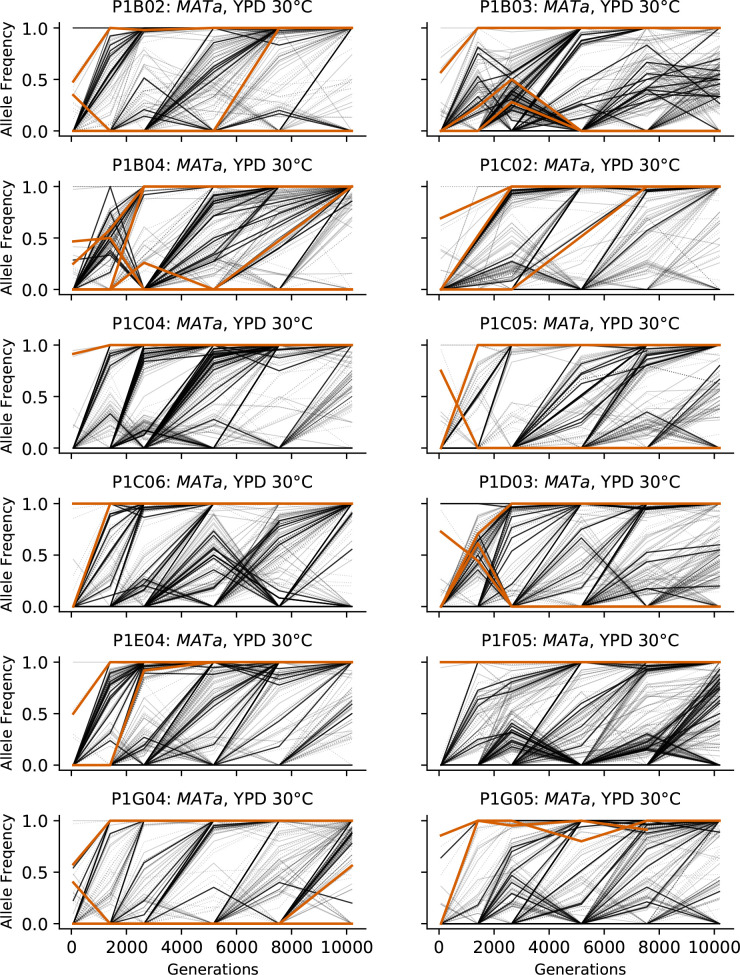
Figure 3—figure supplement 2. Allele frequencies over time in all focal MATa populations in YPD 30°C.

Figure 3—figure supplement 2.

Nonsynonymous mutations in ‘multi-hit’ genes are solid black lines, mutations in the adenine biosynthesis pathway are colored orange, other nonsynonymous mutations are thin gray lines, and synonymous mutations are dotted lines.
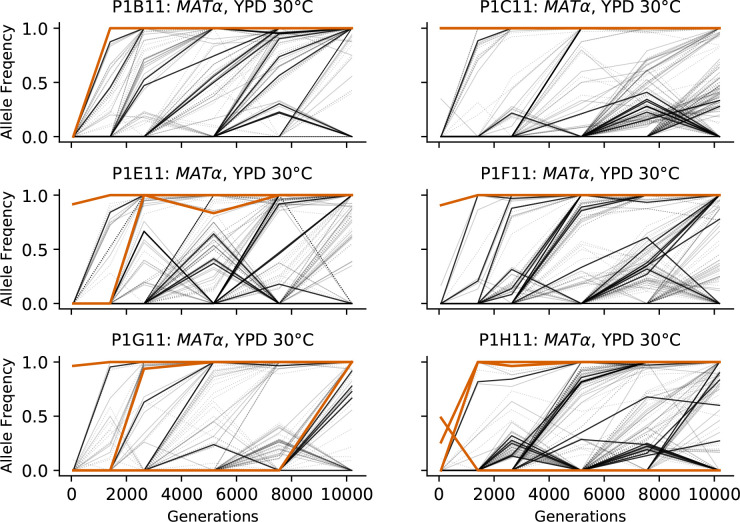
Figure 3—figure supplement 3. Allele frequencies over time in all focal MATα populations in YPD 30°C.

Figure 3—figure supplement 3.

Nonsynonymous mutations in ‘multi-hit’ genes are solid black lines, mutations in the adenine biosynthesis pathway are colored orange, other nonsynonymous mutations are thin gray lines, and synonymous mutations are dotted lines.
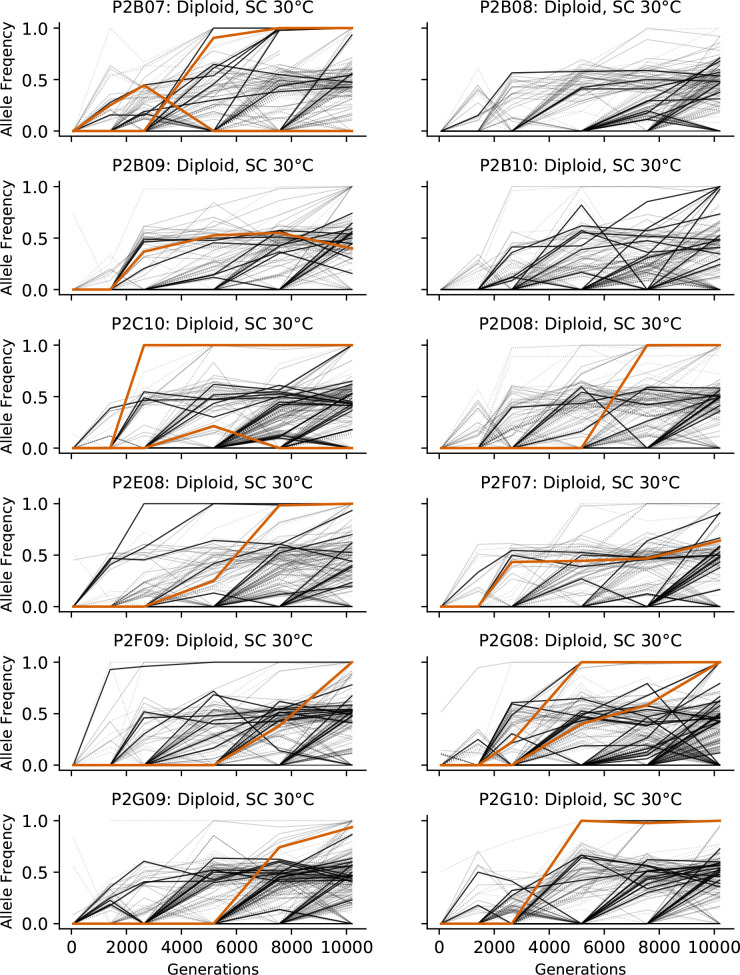
Figure 3—figure supplement 4. Allele frequencies over time in all focal diploid populations in SC 30°C.

Figure 3—figure supplement 4.

Nonsynonymous mutations in ‘multi-hit’ genes are solid black lines, mutations in the adenine biosynthesis pathway are colored orange, other nonsynonymous mutations are thin gray lines, and synonymous mutations are dotted lines.
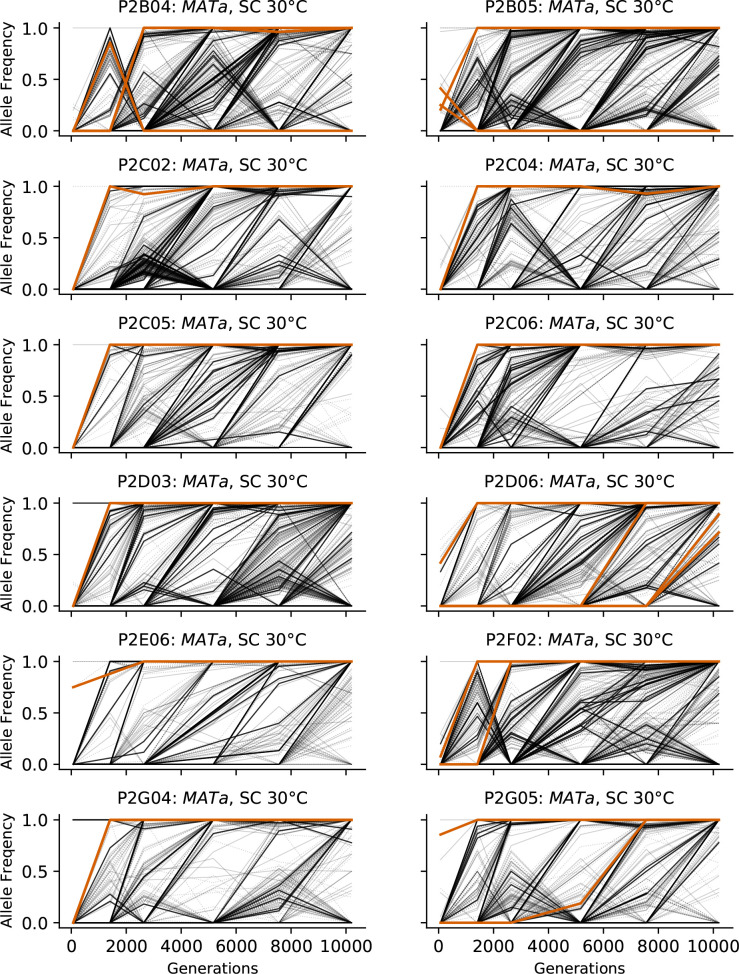
Figure 3—figure supplement 5. Allele frequencies over time in all focal MATa populations in SC 30°C.

Figure 3—figure supplement 5.

Nonsynonymous mutations in ‘multi-hit’ genes are solid black lines, mutations in the adenine biosynthesis pathway are colored orange, other nonsynonymous mutations are thin gray lines, and synonymous mutations are dotted lines.
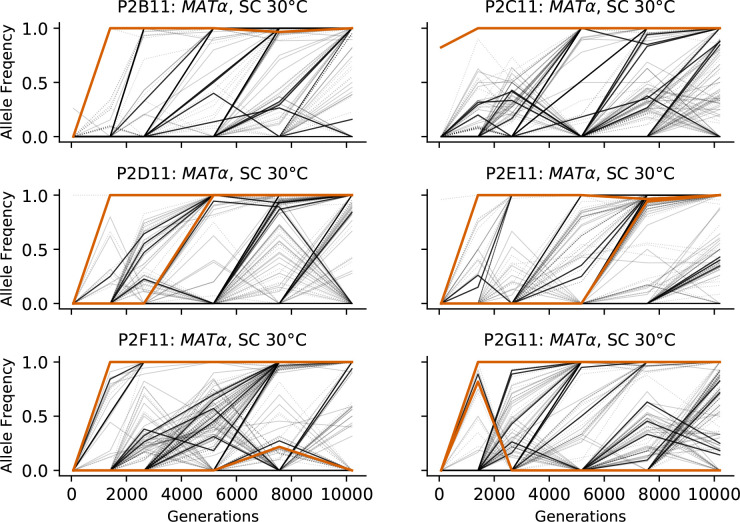
Figure 3—figure supplement 6. Allele frequencies over time in all focal MATα populations in SC 30°C.

Figure 3—figure supplement 6.

Nonsynonymous mutations in ‘multi-hit’ genes are solid black lines, mutations in the adenine biosynthesis pathway are colored orange, other nonsynonymous mutations are thin gray lines, and synonymous mutations are dotted lines.
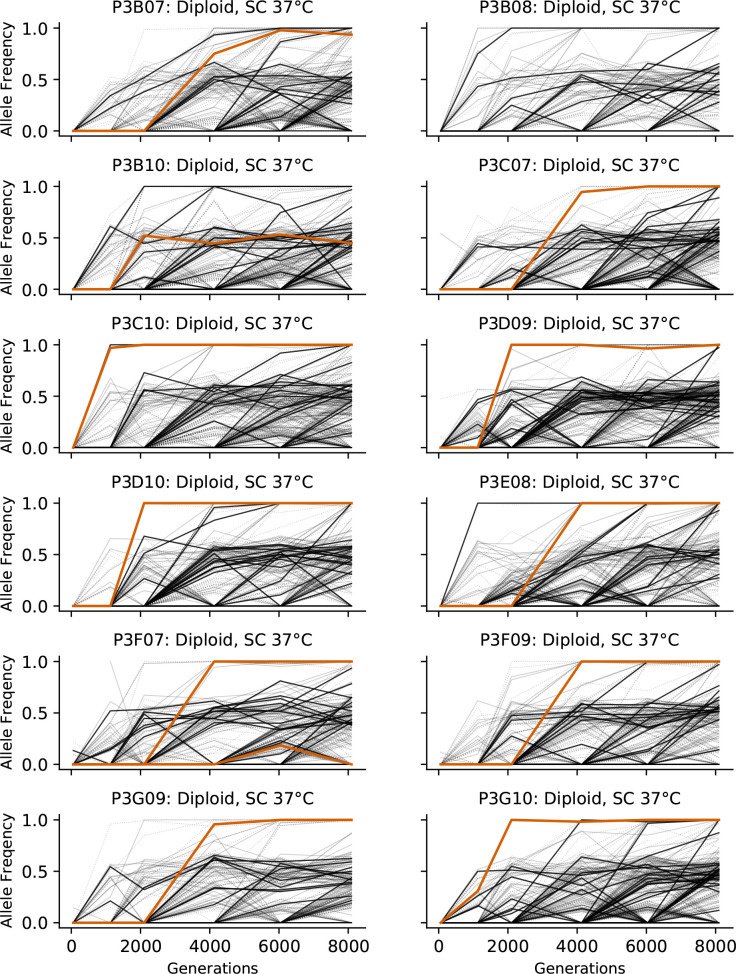
Figure 3—figure supplement 7. Allele frequencies over time in all focal diploid populations in SC 37°C.

Figure 3—figure supplement 7.

Nonsynonymous mutations in ‘multi-hit’ genes are solid black lines, mutations in the adenine biosynthesis pathway are colored orange, other nonsynonymous mutations are thin gray lines, and synonymous mutations are dotted lines.
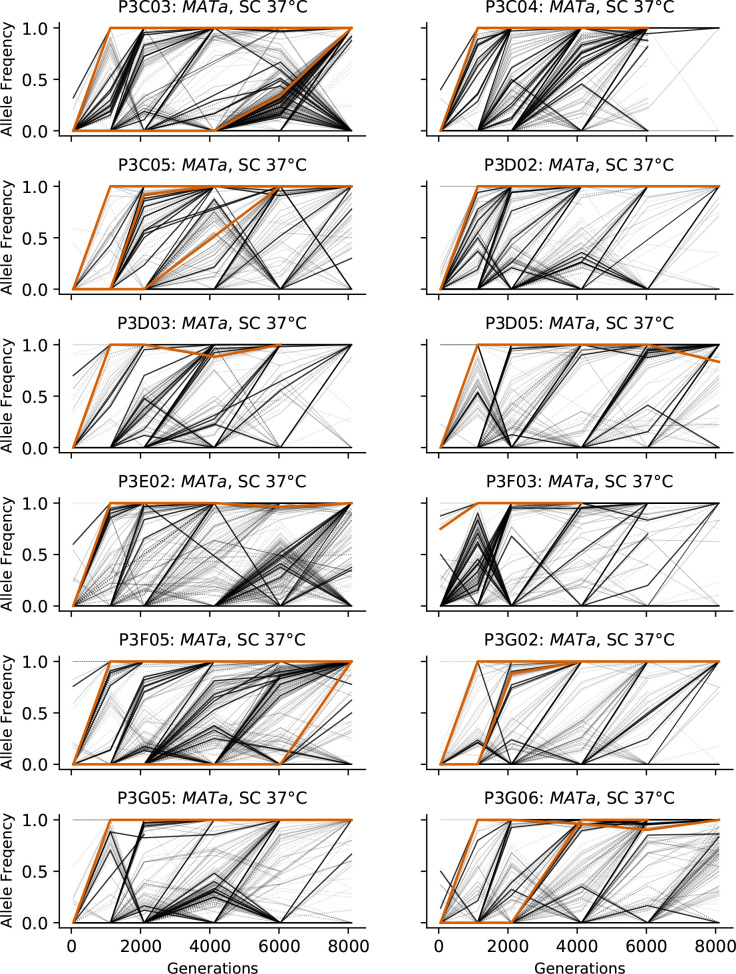
Figure 3—figure supplement 8. Allele frequencies over time in all focal MATa populations in SC 37°C.

Figure 3—figure supplement 8.

Nonsynonymous mutations in ‘multi-hit’ genes are solid black lines, mutations in the adenine biosynthesis pathway are colored orange, other nonsynonymous mutations are thin gray lines, and synonymous mutations are dotted lines.
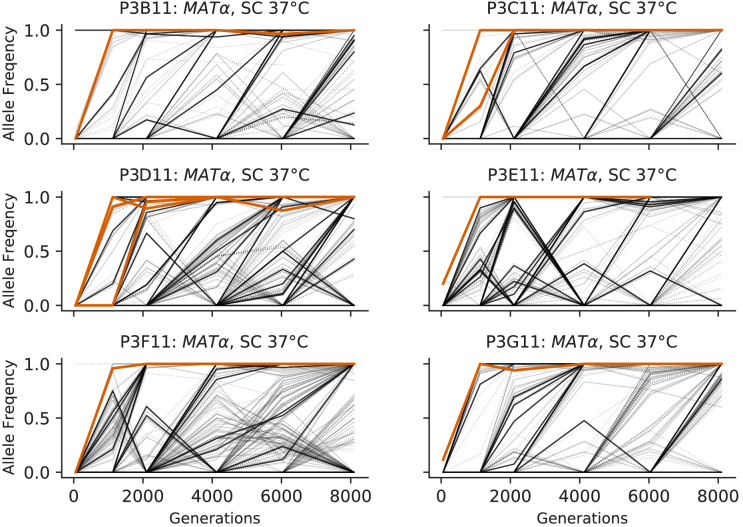
Figure 3—figure supplement 9. Allele frequencies over time in all focal MATα populations in SC 37°C.

Figure 3—figure supplement 9.

Nonsynonymous mutations in ‘multi-hit’ genes are solid black lines, mutations in the adenine biosynthesis pathway are colored orange, other nonsynonymous mutations are thin gray lines, and synonymous mutations are dotted lines.
Figure 3—figure supplement 10. No evidence of coexistence.

Figure 3—figure supplement 10.

The number of mutations present in a population plotted against the number of mutations fixed, both scaled by the total number fixed by the final timepoint. Long-term coexistence of multiple lineages in a population would be visible here as horizontal lines because more mutations would be present over time, but no mutations would fix; we do not observe any clear examples of this here, in contrast to the LTEE.
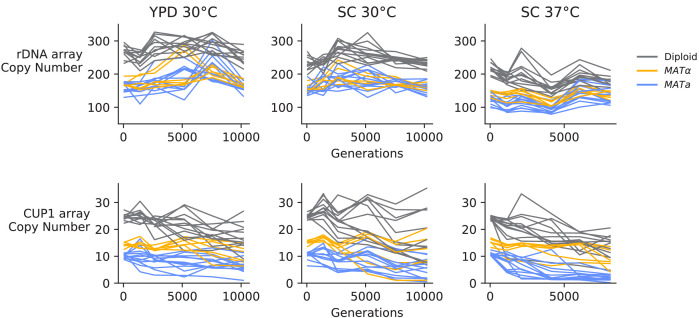
Figure 3—figure supplement 11. Copy number variation in the ribosomal DNA array and CUP1 array, determined from sequencing coverage data.

Figure 3—figure supplement 11.