. 2021 Jan 19;10:e63910. doi: 10.7554/eLife.63910

Figure 4. Types of mutations.

(A) Swarm plot of dN/dS (ratio of nonsynonymous / synonymous fixations by the final timepoint, scaled by the ratio of possible nonsynonymous / synonymous mutations across the genome) for each environment-strain combination. Each point represents one population and the horizontal line represents the median. Asterisks indicate significant differences (p<0.01, Mann-Whitney U test) between strains in the same environment. (B) Breakdown of mutation types for all mutations fixed by the final timepoint, in all populations corresponding to each environment-strain combination.

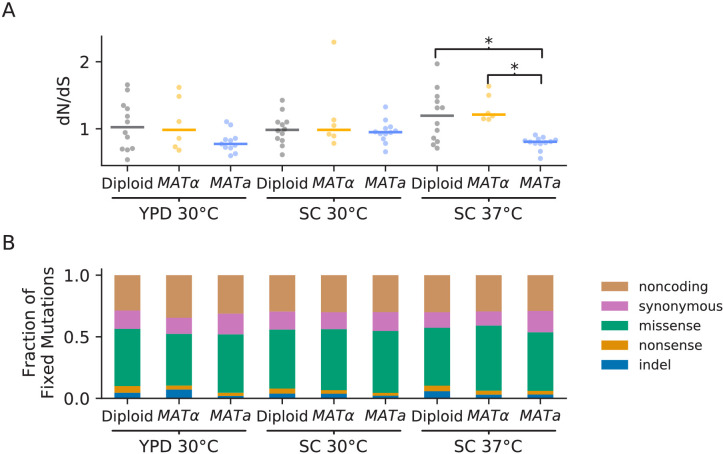
Figure 4.

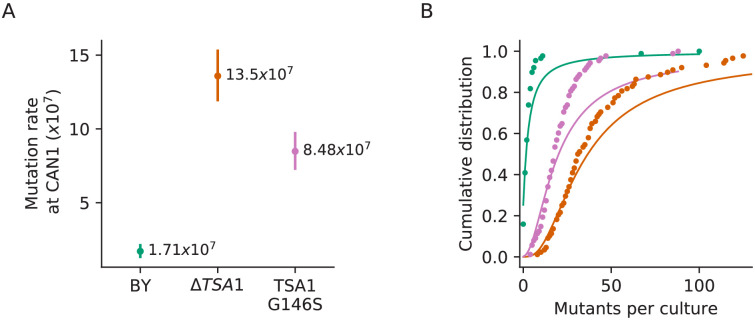
Figure 4—figure supplement 1. Confirmation that the TSA1 mutation increases mutation rate.

Figure 4—figure supplement 1.

(A) Inferred mutation rates of BY4741, BY4741 with TSA1 deleted (YAN727), and BY4741 with the G146S mutation in TSA1 (YAN728). Error bars represent 95% confidence intervals. (B) Cumulative distributions of colony counts from fluctuation assays and corresponding Luria-Delbrück fits, colors are the same as in (A).
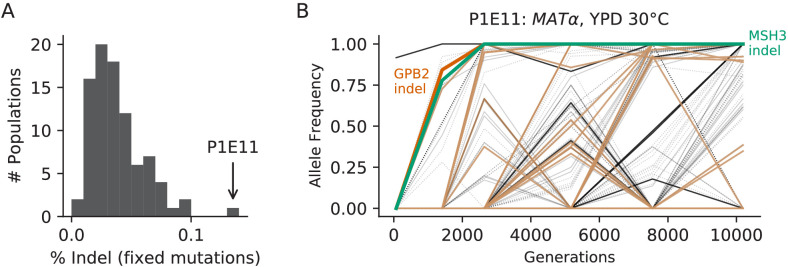
Figure 4—figure supplement 2. Population P1E11, a putative mutator.

Figure 4—figure supplement 2.

(A) Histogram of the percentage of fixed mutations that are indels in all 90 focal populations, with P1E11 indicated by an arrow. (B) Allele frequencies of mutations in P1E11. Nonsynonymous mutations in ‘multi-hit’ genes are solid black lines, other nonsynonymous mutations are thin gray lines, synonymous mutations are dotted lines, indels are brown lines, and mutations in MSH3 and GPB2 are colored and labeled. We hypothesize that the MSH3 mutation hitchhiked to fixation with the selected GPB2 indel mutation, which occurred partially due to higher rates of indel mutations in strains without proper MSH3 function.
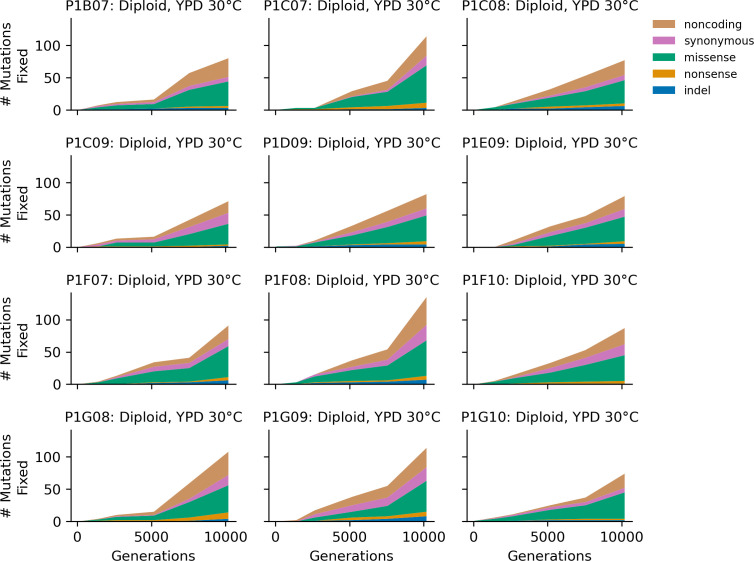
Figure 4—figure supplement 3. Stacked plot of heterozygous or homozygous fixed mutation types over time in all focal diploid populations in YPD 30°C.

Figure 4—figure supplement 3.

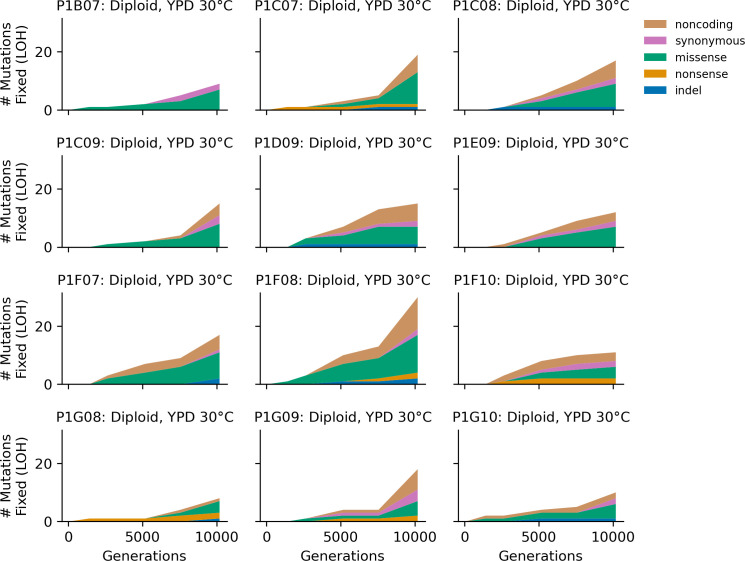
Figure 4—figure supplement 4. Stacked plot of homozygous-only (lost heterozygosity) fixed mutation types over time in all focal diploid populations in YPD 30°C.

Figure 4—figure supplement 4.

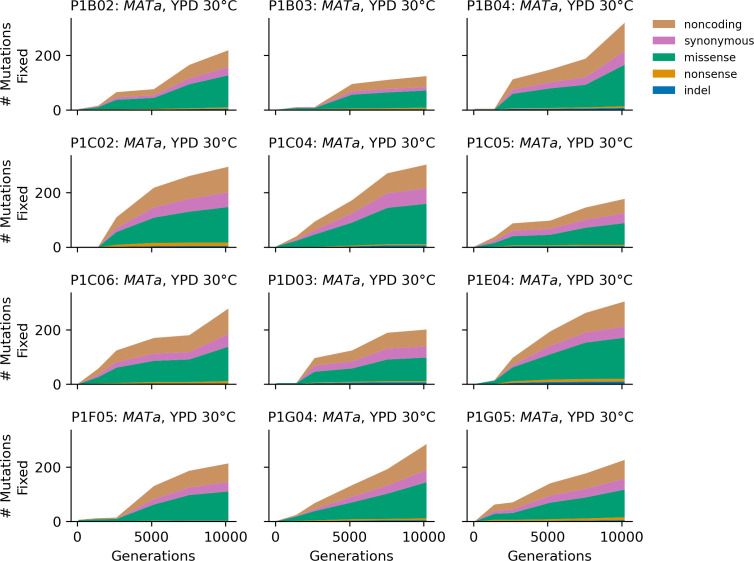
Figure 4—figure supplement 5. Stacked plot of fixed mutation types over time in all focal MATa populations in YPD 30°C.

Figure 4—figure supplement 5.

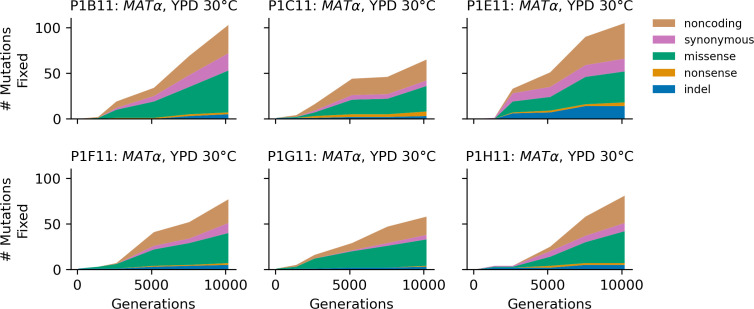
Figure 4—figure supplement 6. Stacked plot of fixed mutation types over time in all focal MATα populations in YPD 30°C.

Figure 4—figure supplement 6.

Figure 4—figure supplement 7. Stacked plot of heterozygous or homozygous fixed mutation types over time in all focal diploid populations in SC 30°C.

Figure 4—figure supplement 7.

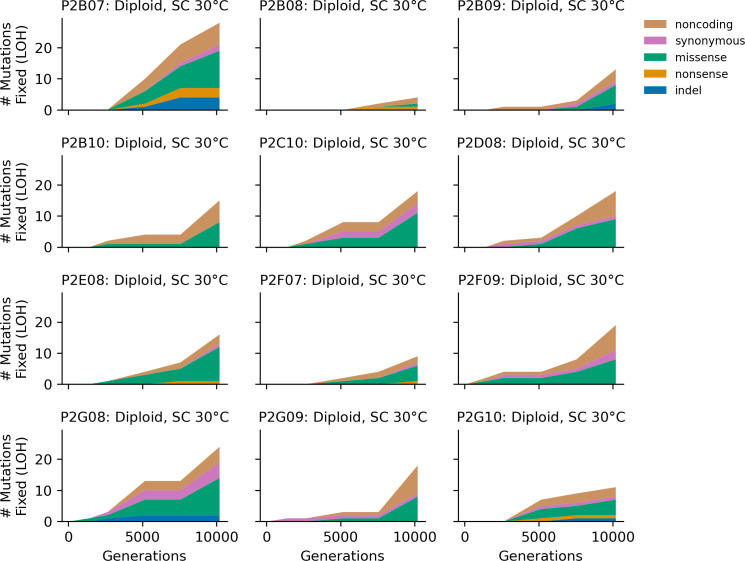
Figure 4—figure supplement 8. Stacked plot of homozygous-only (lost heterozygosity) fixed mutation types over time in all focal diploid populations in SC 30°C.

Figure 4—figure supplement 8.

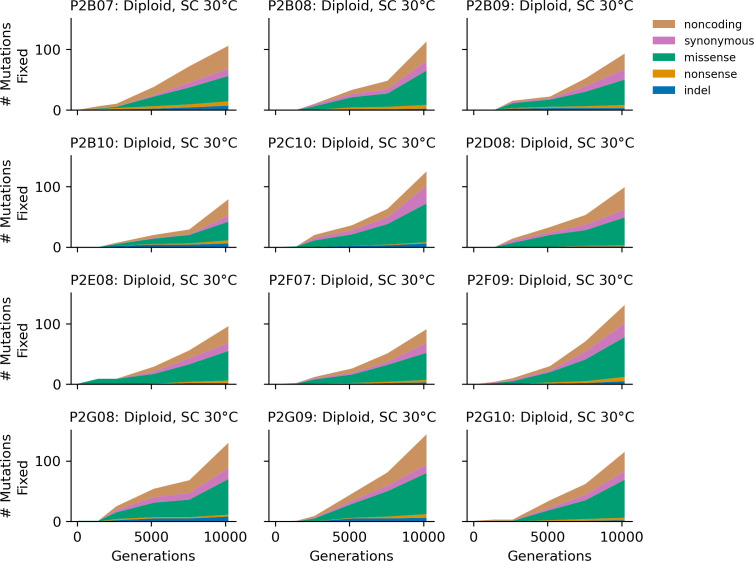
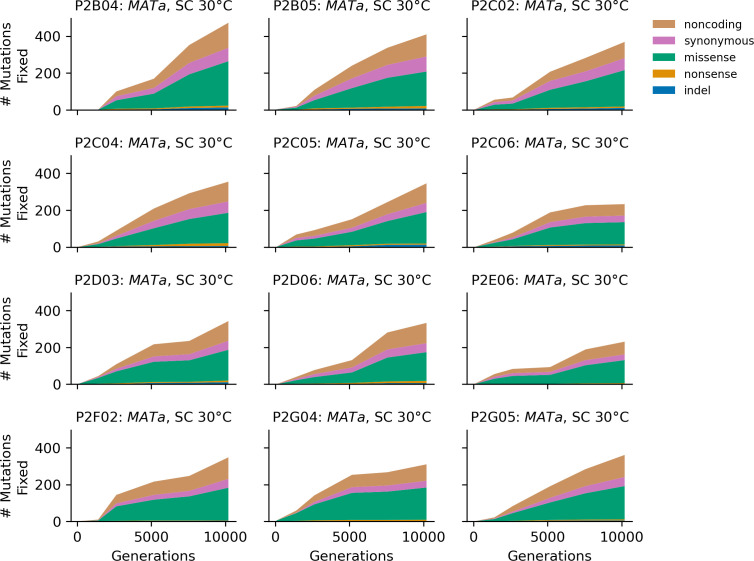
Figure 4—figure supplement 9. Stacked plot of fixed mutation types over time in all focal MATa populations in SC 30°C.

Figure 4—figure supplement 9.

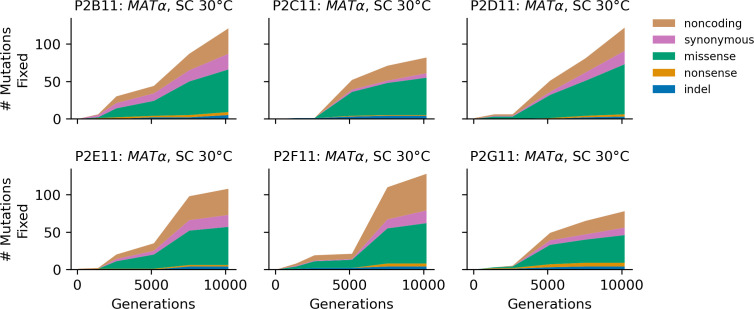
Figure 4—figure supplement 10. Stacked plot of fixed mutation types over time in all focal MATα populations in SC 30°C.

Figure 4—figure supplement 10.

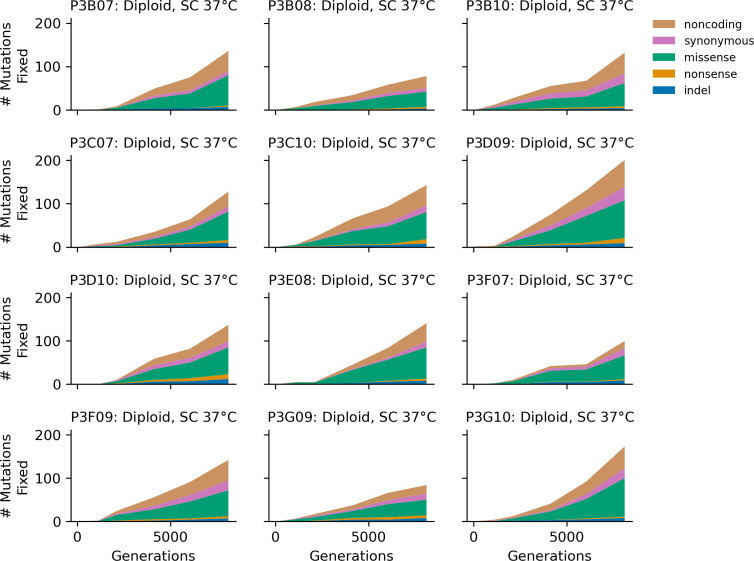
Figure 4—figure supplement 11. Stacked plot of heterozygous or homozygous fixed mutation types over time in all focal diploid populations in SC 37°C.

Figure 4—figure supplement 11.

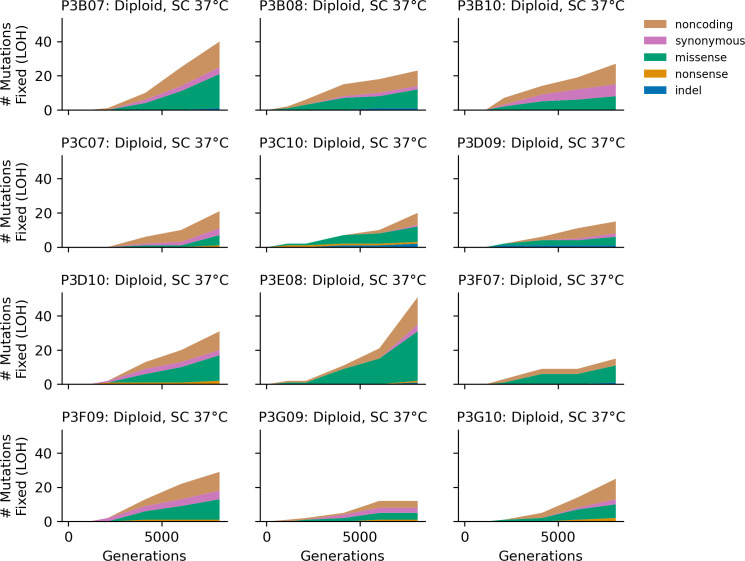
Figure 4—figure supplement 12. Stacked plot of homozygous-only (lost heterozygosity) fixed mutation types over time in all focal diploid populations in SC 37°C.

Figure 4—figure supplement 12.

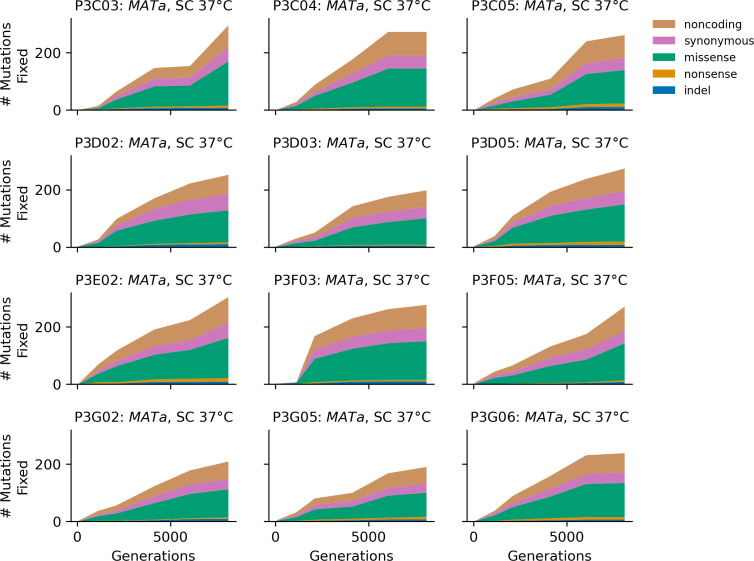
Figure 4—figure supplement 13. Stacked plot of fixed mutation types over time in all focal MATa populations in SC 37°C.

Figure 4—figure supplement 13.

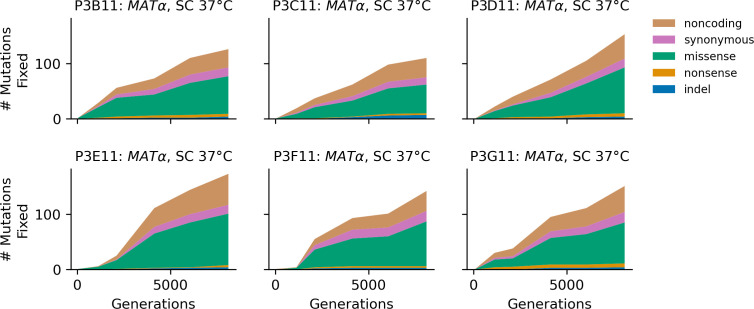
Figure 4—figure supplement 14. Stacked plot of fixed mutation types over time in all focal MATα populations in SC 37°C.

Figure 4—figure supplement 14.