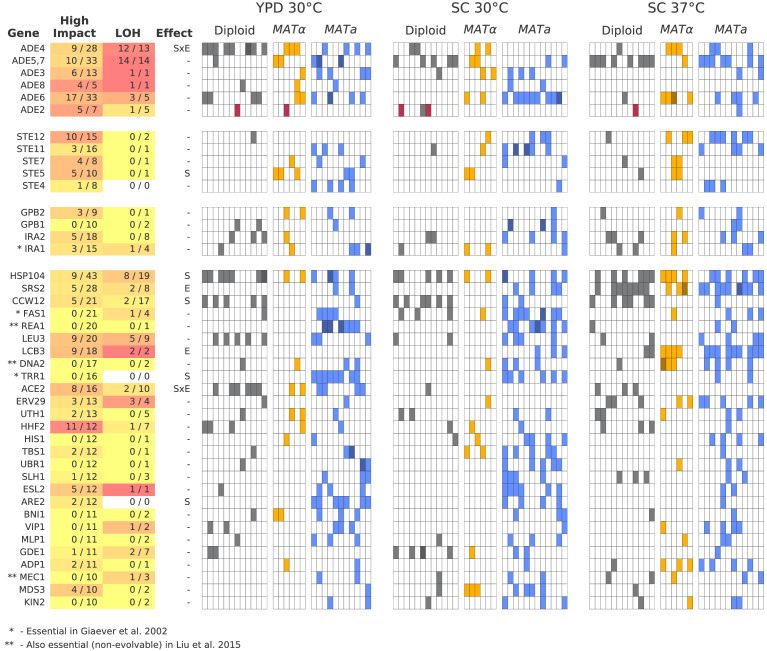
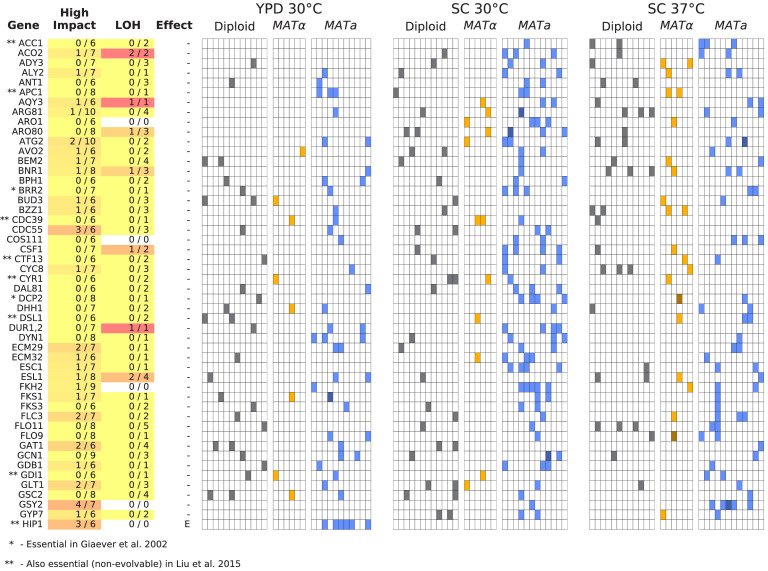
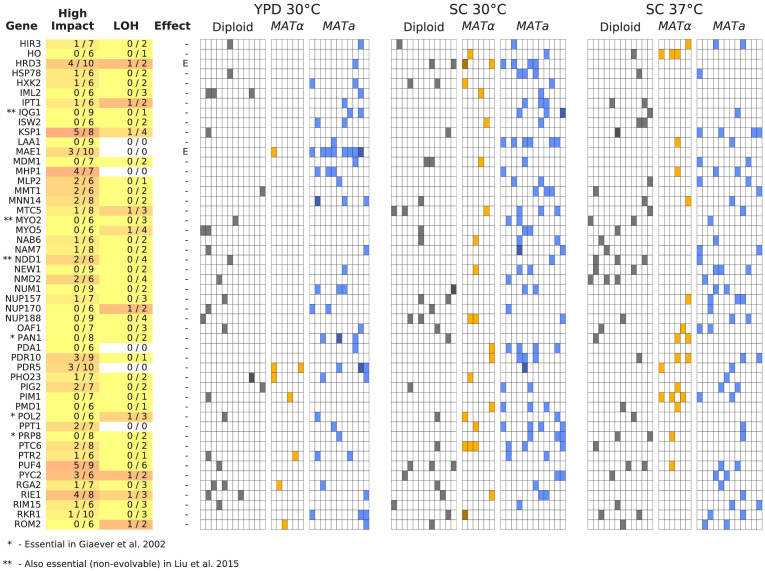
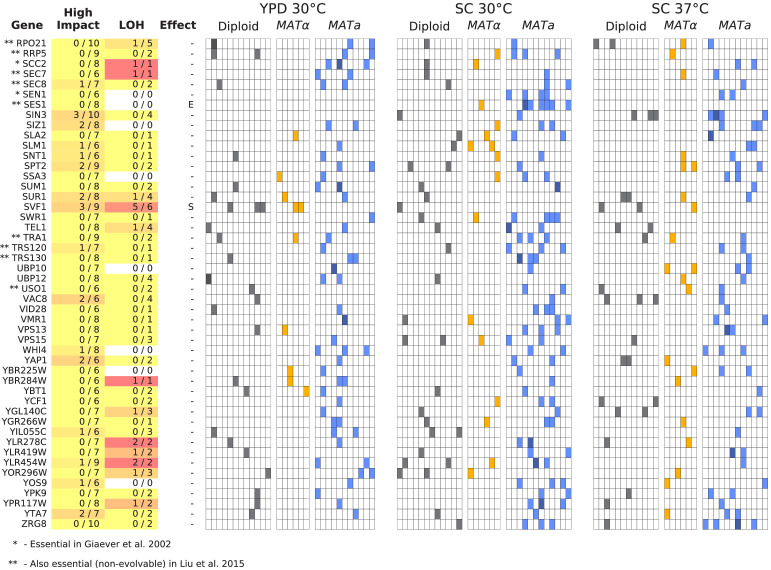
Figure 6. Multi-hit genes.
Each row represents a gene. The first three blocks are groups of genes identified from gene-ontology enrichment analysis of multi-hit genes (from top to bottom: adenine biosynthesis, sterility, and negative regulation of the Ras pathway). The bottom block is all other genes with hits in at least 10 populations. Each column in the heatmap represents a population, such that if a gene is hit in that population the square will be colored (darker color if a gene is hit two or more times in that population). Red squares indicate premature-stop-lost mutations in ADE2, which correspond to the populations with asterisks in Figure 2. One population that was not sequenced (not shown here) also has this mutation (confirmed by Sanger sequencing). The table at left gives more information on each multi-hit gene: ‘High impact’ is the fraction of hits that are likely to cause a loss-of-function, as annotated by SnpEff (e.g. nonsense mutations), ‘LOH’ (loss of heterozygosity) is the fraction of hits in diploid populations that fix homozygously, and ‘Effect’ describes whether the hits are distributed significantly unevenly across strain-types (S), environments (E), or both (SxE), when compared to a null model where fixations are not strain or environment dependent.


