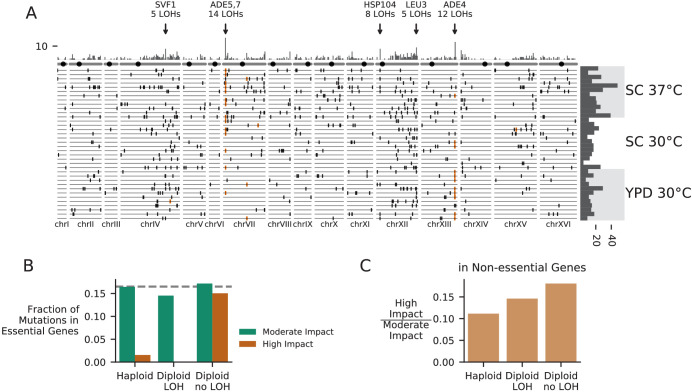
Figure 8. Patterns of molecular evolution and loss of heterozygosity in diploids.
(A) Genomic positions of all mutations that experienced loss of heterozygosity (LOH) across all diploid populations (loss of heterozygosity defined by a mutation reaching >90% frequency). Orange marks represent mutations in the ADE pathway. Each horizontal line represents one population, and the histogram at right represents the total number of LOH fixations in each population, with populations arranged by environment. The top histogram represents the frequency of loss of heterozygosity across the genome, and the chromosomes underneath show the centromere location with a black circle. Genes with five or more LOH fixations are annotated. (B) The fraction of fixed nonsynonymous mutations that are in essential genes, plotted for mutations fixed in haploid populations, mutations fixed homozygously in diploid populations (LOH) and mutations fixed heterozygously in diploid populations, plotted separately for mutations annotated as high or moderate impact by SnpEff (high-impact mutations are likely to cause loss-of-function). The dashed line represents the fraction of the coding genome that is in essential genes. (C) The ratio of high-impact to moderate-impact fixations in the same three mutation groups as in (B), for mutations in non-essential genes only.


