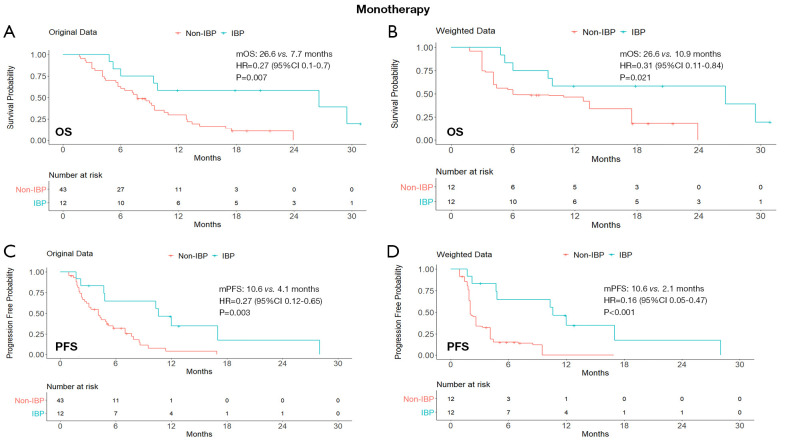
Figure 2.
Kaplan-Meier curves of OS (A,B) and PFS (C,D) from original data and weighted data in the initial immune monotherapy subgroup. IBP, immunotherapy beyond progression; non-IBP, non-immunotherapy beyond progression; mOS, median overall survival; mPFS, median progression-free survival; HR, hazard ratio; CI, confidence interval.

